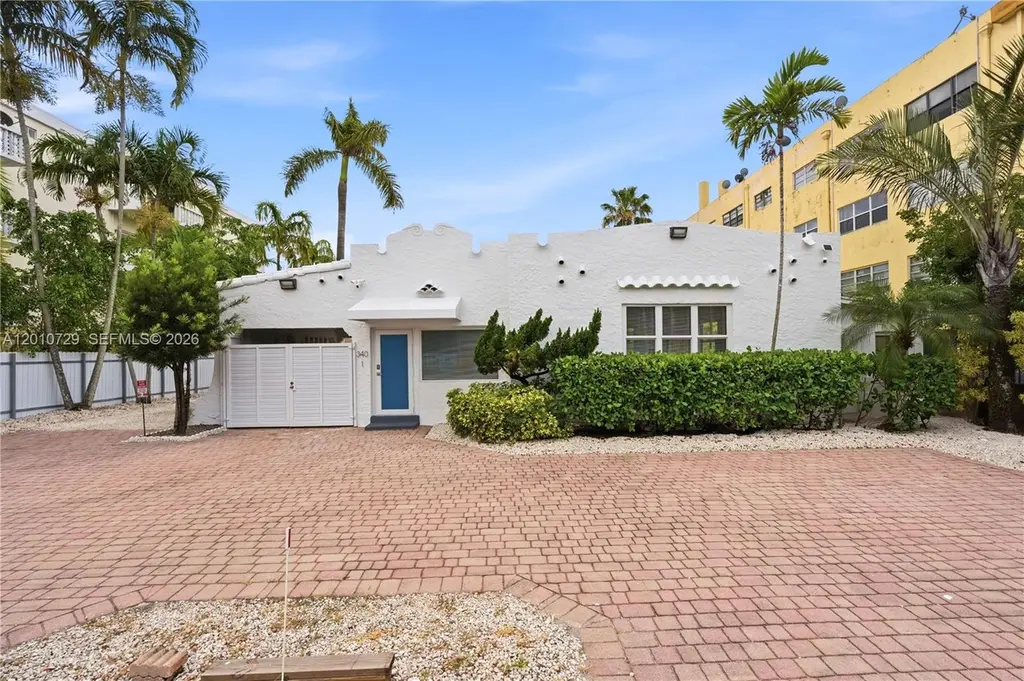
340 NE 125th St
North Miami, FL 33161
$1,550,000D
2 bd · 1.0 ba ·
1,785 sqft ·
Built 1927
· MultiFamily
· Active
· 48 DOM
Cashflow @ list (25.0% down · 7.5%)
Estimated rent
$13,578/mo
Mortgage (P&I)
−$8,128
Tax + insurance
−$2,070
HOA
−$0
Vac / Maint / Mgmt
−$2,851
Net cashflow
$528/mo
Annual
$6,334/yr
Cap rate
6.70%
Cash-on-cash
1.46%
DSCR
1.06
1% rule
0.88%
Cash to close
$434,000
Investor read
- This is a 2×2bd/1ba + 2×1bd/1ba units multifamily listed at $1.55M.
- At list price, monthly cash flow is $528 ($6k/yr) — positive. Per door: $132/mo.
- The deal already cash-flows at list — no discount required.
- To meet the 1% rule (rent ≥ 1% of price), the offer needs to be $1.36M (12.4% below list).
- It's been on market 48 days — a 3% lower offer ($1.50M) is reasonable based on typical stale-listing flexibility.
- Recommended offer: $1.36M (12.4% below list) — sets the bar for 1% rule.
- Local home prices are declining (-3.0%/yr); year-one equity from $11k of loan paydown is wiped out by about $46k of value loss. Plan a longer hold.
- Location reads 83/100 on livability (#51 in FL, #914 nationally) — a professional / high-income tenant draw. Strengths: amenities A+, commute A+, health & safety A+; Watch: schools D+, employment D.
- Miami-Dade (suburban): math 45% / reading 54% proficiency, ranked #40 of 73 in FL (top 55%) — families likely to look elsewhere, expect single-tenant / working-renter base with shorter leases; 64% free/reduced lunch — lower-income household profile, screen leases tightly.
- Watch-outs: built in 1927 — expect roof / HVAC / electrical / plumbing capex.
- Market conditions: Rents soft (-0.7%/yr); 338 active listings in the ZIP; 10,051 units permitted in Miami-Dade County in 2024 (7,758 in 5+ unit buildings).
- Miami-Dade County population projected at +28% by 2050 — long-run rental-demand tailwind backs the buy-and-hold thesis.
- 4 sale attempts since 4y ago with the ask held roughly flat each time — persistent listings suggest the price (not the market) is what's stuck; bring a comps-based counter.
- Current owner paid $1.00M; list at $1.55M implies a 55% gain — meaningful room to come down on a strong offer.
- Climate carrying-cost: moderate flood risk; severe wind risk, 99% chance of damaging wind over 30y; extreme-heat days projected 6→24/yr by 2055 (HVAC capex compounding) — expect insurance premiums to compound above CPI over the hold.
- Cap rate 6.7% vs local median 4.1% in North Miami — top-decile yield for the area; either an underpriced asset or a hidden risk that comps aren't pricing in. Stress-test before assuming the spread holds.
- At $13,578/mo this rent would consume 279% of the median local household income ($58k/yr) (locally 3226% of renters already pay >50% of income on rent) — very limited rent-growth headroom before tenants either downsize or default.
Questions for listing agent
- It's been on market 48 days. Have you received any prior offers? Is the seller open to a 12% concession, seller financing, or rate buy-down credit?
- Can we see the unit-by-unit rent roll, current vacancy, and any below-market leases? What's the average tenancy length?
- What capital expenditures (roof, boiler, parking lot, exteriors) have been made in the last 5 years, and what's planned in the next 2?
- Built in 1927 — when were the roof, HVAC, electrical panel, plumbing, and water heater last replaced?
- Is there a deadline driving the sale (1031 exchange, divorce, estate, relocation)? That informs how much negotiation room exists.
- Schools are D-rated, which usually means shorter tenancies and higher turnover. Who's the typical renter profile here, and what's been the actual vacancy rate?
- The area grade is low — what's the realistic commute time and amenity access for the typical tenant pool here? Any planned neighborhood developments (good or bad) we should know about?
- What's the average days-on-market for RENTAL listings here right now (not sales)? A rising rental-DOM trend means longer vacancies and softer asking-rent achievability than the comps imply.
CashFlowRE · CFR-80X84JBSVH2XM0
· Data 2 days ago
cashflowre.app · 2026-05-29