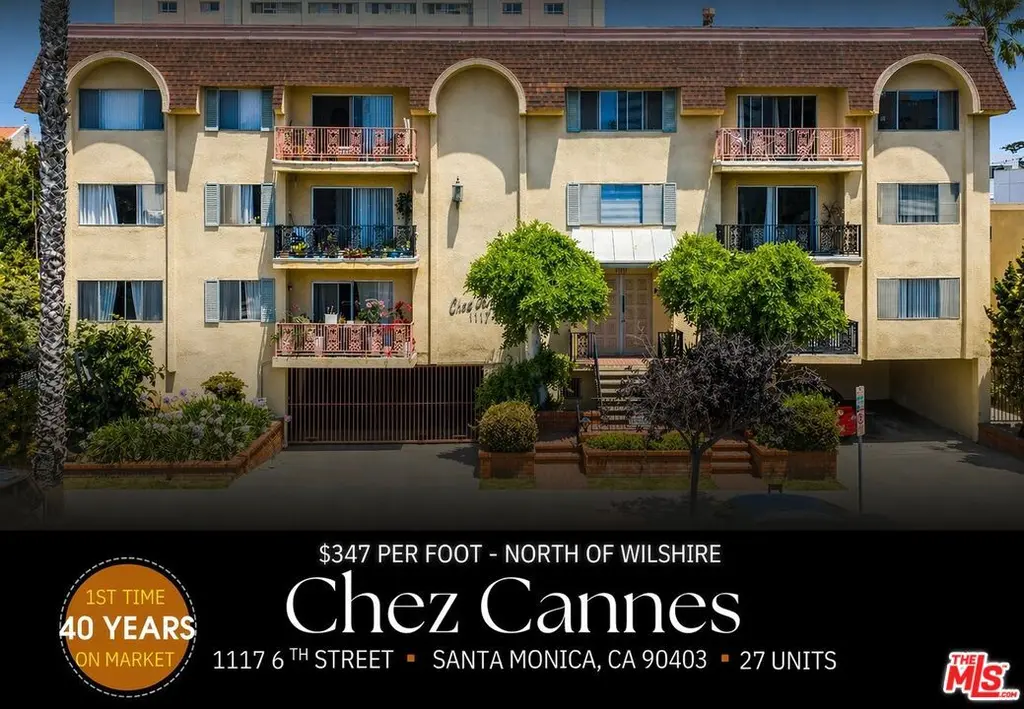
1117 6th St
Santa Monica, CA 90403
$10,250,000B-
36 bd · 45.0 ba ·
29,535 sqft ·
Built 1971
· MultiFamily
· Pending
· 272 DOM
Cashflow @ list (25.0% down · 7.5%)
Estimated rent
$99,313/mo
Mortgage (P&I)
−$53,752
Tax + insurance
−$7,302
HOA
−$0
Vac / Maint / Mgmt
−$20,856
Net cashflow
$17,403/mo
Annual
$208,839/yr
Cap rate
8.33%
Cash-on-cash
7.28%
DSCR
1.32
1% rule
0.97%
Cash to close
$2,870,000
Investor read
- This is a 9×1bd/1ba + 10×1bd/1.5ba + 8×2bd/2ba units multifamily listed at $10.25M.
- At list price, monthly cash flow is $17k ($209k/yr) — positive. Per door: $645/mo.
- The deal already cash-flows at list — no discount required.
- To meet the 1% rule (rent ≥ 1% of price), the offer needs to be $9.93M (3.1% below list).
- It's been on market 272 days — a 12% lower offer ($9.02M) is reasonable based on typical stale-listing flexibility.
- Recommended offer: $9.02M (12.0% below list) — sets the bar for market timing.
- In year one you build about $61k of equity ($71k loan paydown + $-10k appreciation (-0.1% local appreciation)).
- Location reads 72/100 on livability (#178 in CA) — a middle-class / working-renter tenant base. Strengths: schools A+, amenities A+, commute A+; Watch: health & safety C-, crime F, cost of living F.
- Santa Monica-Malibu Unified (urban): math 61% / reading 74% proficiency, ranked #123 of 1,400 in CA (top 9%) — acceptable for families but not a draw, mixed tenant base, ~2y average lease.
- Market conditions: Rents soft (-0.1%/yr); 93 active listings in the ZIP; high-income renter base; 19,697 units permitted in Los Angeles County in 2024 (9,426 in 5+ unit buildings).
- Los Angeles County population projected at +9% by 2050 — modest demand growth; plan on rents tracking national, not racing it.
- At projected returns (-0.1% appreciation + 0.0% rent growth), your $2.87M cash investment doubles in ~10 years — after that, you're playing with house money.
- By year 8, paydown + projected appreciation supports a ~$686k cash-out refi (75% LTV) — recoverable capital for the next deal without selling this one.
- Climate carrying-cost: extreme-heat days projected 7→20/yr by 2055 (HVAC capex compounding) — expect insurance premiums to compound above CPI over the hold.
- Cap rate 8.3% vs local median 1.2% in Santa Monica — top-decile yield for the area; either an underpriced asset or a hidden risk that comps aren't pricing in. Stress-test before assuming the spread holds.
- At $99,313/mo this rent would consume 977% of the median local household income ($122k/yr) (locally 2265% of renters already pay >50% of income on rent) — very limited rent-growth headroom before tenants either downsize or default.
Questions for listing agent
- It's been on market 272 days. Have you received any prior offers? Is the seller open to a 12% concession, seller financing, or rate buy-down credit?
- Can we see the unit-by-unit rent roll, current vacancy, and any below-market leases? What's the average tenancy length?
- What capital expenditures (roof, boiler, parking lot, exteriors) have been made in the last 5 years, and what's planned in the next 2?
- Built in 1971 — when were the roof, HVAC, electrical panel, plumbing, and water heater last replaced?
- Why hasn't it sold? Are there any deal-killer items the seller is aware of (foundation, flood, title, zoning, code violations)?
- Is there a deadline driving the sale (1031 exchange, divorce, estate, relocation)? That informs how much negotiation room exists.
- Schools are A-rated — typically a magnet for longer-tenancy family renters. What's the average tenant stay here, and is there a school-zone premium baked into asking?
- Crime grade is F in this area — have there been break-ins, vandalism, or insurance claims at this property in the last 3 years? What carrier currently insures it and at what premium?
CashFlowRE · CFR-80Z27339YES1CC
· Data 3 weeks ago
cashflowre.app · 2026-05-29