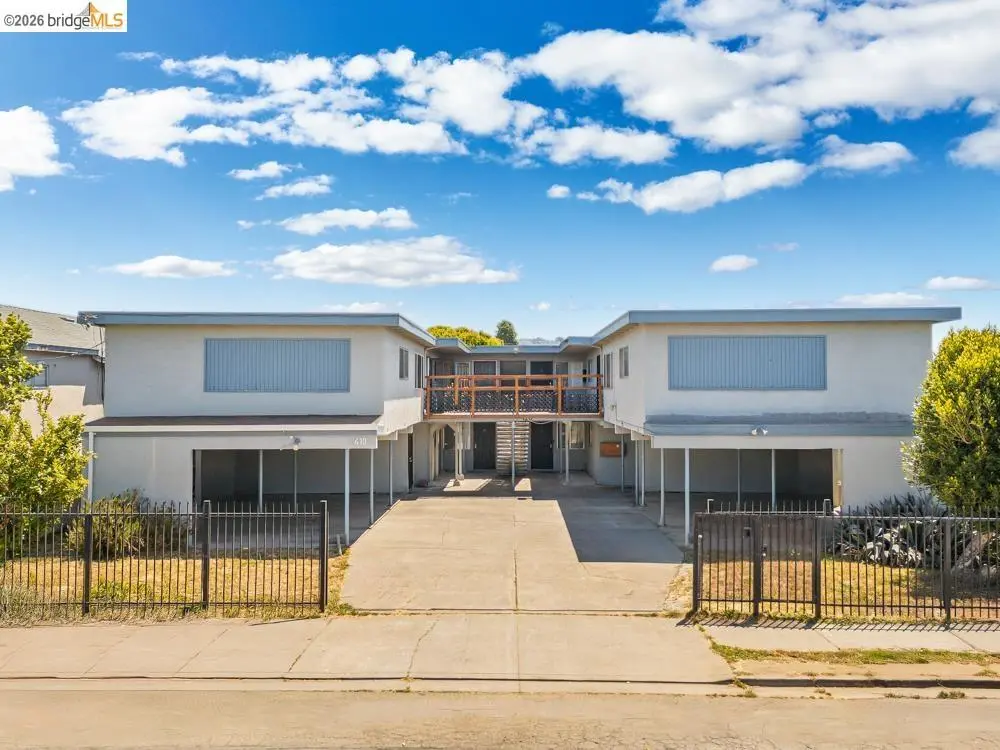
410 S 34th St
Richmond, CA 94804
$1,250,000C
None bd · None ba ·
4,814 sqft ·
Built 1963
· MultiFamily
· Active
· 19 DOM
Cashflow @ list (25.0% down · 7.5%)
Estimated rent
$14,427/mo
Mortgage (P&I)
−$6,555
Tax + insurance
−$1,910
HOA
−$0
Vac / Maint / Mgmt
−$3,030
Net cashflow
$2,932/mo
Annual
$35,181/yr
Cap rate
9.11%
Cash-on-cash
10.05%
DSCR
1.45
1% rule
1.15%
Cash to close
$350,000
Investor read
- This is a 6 × 2-bed/1-bath units multifamily listed at $1.25M.
- At list price, monthly cash flow is $3k ($35k/yr) — positive. Per door: $489/mo.
- The deal already cash-flows at list — no discount required.
- Meets the 1% rule at list price ($14k rent vs $1.25M).
- It's been on market 19 days — a 2% lower offer ($1.23M) is reasonable based on typical stale-listing flexibility.
- Recommended offer: $1.23M (1.5% below list) — sets the bar for market timing.
- Local home prices are declining (-3.0%/yr); year-one equity from $9k of loan paydown is wiped out by about $38k of value loss. Plan a longer hold.
- Location reads 62/100 on livability (#497 in CA) — a middle-class / working-renter tenant base. Strengths: commute A+, employment A, health & safety B+; Watch: crime F, amenities F, cost of living F.
- West Contra Costa Unified (suburban): math 24% / reading 35% proficiency, ranked #993 of 1,400 in CA (top 71%) — low school quality limits family demand, transient renter base, plan for 1-2y turnover.
- Zoned schools: Stege Elementary (253 students, 80% FRL); Fred T. Korematsu Middle (681 students, 33% FRL); John F. Kennedy High (823 students, 66% FRL) — zoned schools at 60% FRL track the district average.
- Market conditions: Rents flat; 137 active listings in the ZIP; 1 comparable units currently listed for rent nearby; solid renter incomes; 2,169 units permitted in Contra Costa County in 2024 (896 in 5+ unit buildings).
- Contra Costa County population projected at +26% by 2050 — long-run rental-demand tailwind backs the buy-and-hold thesis.
- 7 sale attempts since 20y ago with the ask held roughly flat each time — persistent listings suggest the price (not the market) is what's stuck; bring a comps-based counter.
- Current owner paid $550k; list at $1.25M implies a 127% gain — meaningful room to come down on a strong offer.
- Cap rate 9.1% vs local median 2.7% in Richmond — top-decile yield for the area; either an underpriced asset or a hidden risk that comps aren't pricing in. Stress-test before assuming the spread holds.
- At $14,427/mo this rent would consume 190% of the median local household income ($91k/yr) (locally 2065% of renters already pay >50% of income on rent) — very limited rent-growth headroom before tenants either downsize or default.
Questions for listing agent
- Can we see the unit-by-unit rent roll, current vacancy, and any below-market leases? What's the average tenancy length?
- What capital expenditures (roof, boiler, parking lot, exteriors) have been made in the last 5 years, and what's planned in the next 2?
- Built in 1963 — when were the roof, HVAC, electrical panel, plumbing, and water heater last replaced?
- Is there a deadline driving the sale (1031 exchange, divorce, estate, relocation)? That informs how much negotiation room exists.
- Schools are F-rated, which usually means shorter tenancies and higher turnover. Who's the typical renter profile here, and what's been the actual vacancy rate?
- Crime grade is F in this area — have there been break-ins, vandalism, or insurance claims at this property in the last 3 years? What carrier currently insures it and at what premium?
- What's the average days-on-market for RENTAL listings here right now (not sales)? A rising rental-DOM trend means longer vacancies and softer asking-rent achievability than the comps imply.
- What's the recent tenant-quality profile in this submarket — average credit score on applications, eviction rate, late-payment / NSF rate, and stable-employment percentage? A property-management company in the area should have these aggregated.
CashFlowRE · CFR-84KYENB0MNYJTN
· Data 16 h ago
cashflowre.app · 2026-05-29