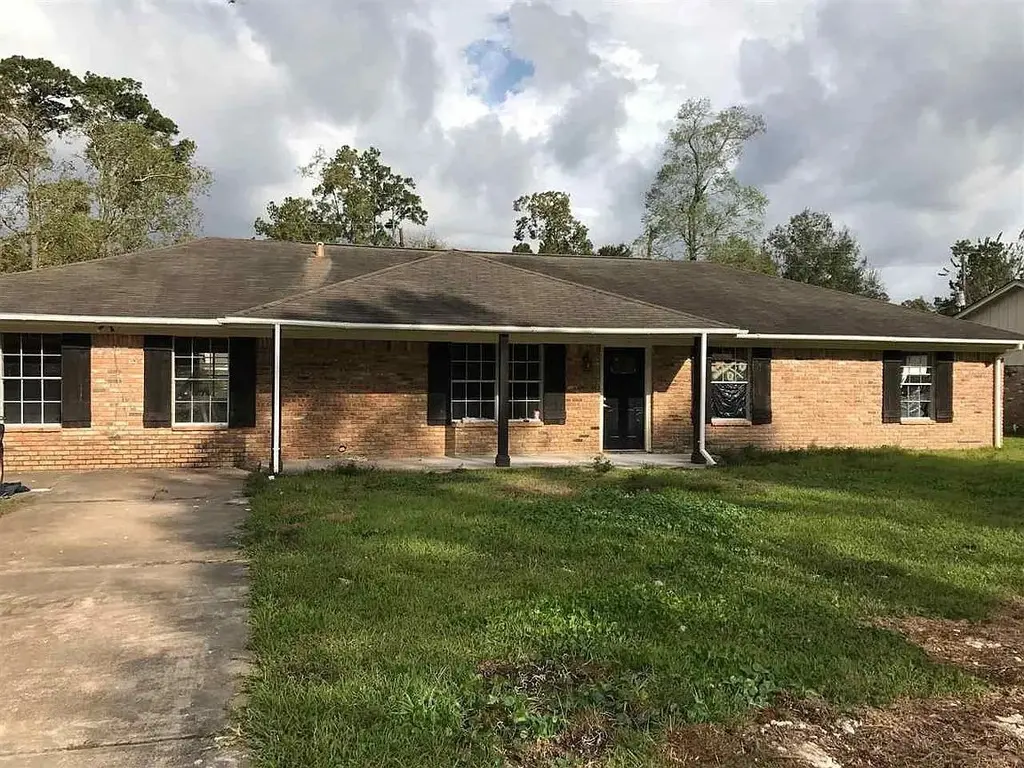
134 Woodlawn Dr
Pinewood Estates, TX 77659
$90,000B
3 bd · 2.0 ba ·
2,310 sqft ·
Built 1963
· SingleFamily
· Pending
· 10 DOM
Cashflow @ list (25.0% down · 7.5%)
Estimated rent
$1,554/mo
Mortgage (P&I)
−$472
Tax + insurance
−$336
HOA
−$0
Vac / Maint / Mgmt
−$326
Net cashflow
$420/mo
Annual
$5,038/yr
Cap rate
11.89%
Cash-on-cash
19.99%
DSCR
1.89
1% rule
1.73%
Cash to close
$25,200
Investor read
- This is a 3-bed/2.0-bath single-family listed at $90k.
- At list price, monthly cash flow is $420 ($5k/yr) — positive.
- The deal already cash-flows at list — no discount required.
- Meets the 1% rule at list price ($2k rent vs $90k).
- Only 10 days on market — expect competitive offers; lowballing is unlikely to land.
- Local home prices are declining (-3.0%/yr); year-one equity from $622 of loan paydown is wiped out by about $3k of value loss. Plan a longer hold.
- Location reads 68/100 on livability (#484 in TX) — a middle-class / working-renter tenant base. Strengths: crime A+, employment A+, housing A+; Watch: amenities F, commute F, health & safety F.
- Hardin-Jefferson ISD (rural): math 54% / reading 49% proficiency, ranked #135 of 826 in TX (top 16%) — acceptable for families but not a draw, mixed tenant base, ~2y average lease.
- Zoned schools: Sour Lake El (math 43% / reading 43%, grade F, #1,283 of 4,322 statewide, top 30%, 767 students, 42% FRL); Henderson Middle (math 59% / reading 47%, grade C+, #281 of 1,662 statewide, top 18%, 617 students, 41% FRL); Hardin-Jefferson H S (math 68% / reading 67%, grade B, #158 of 1,632 statewide, top 10%, 749 students, 38% FRL).
- Watch-outs: property tax is 4.0% of price.
- Market conditions: 93 active listings in the ZIP; 358 units permitted in Hardin County in 2024 (0 in 5+ unit buildings).
- 2 sale attempts since 8y ago with the ask held roughly flat each time — persistent listings suggest the price (not the market) is what's stuck; bring a comps-based counter.
- At projected returns (-3.0% appreciation + 3.0% rent growth), your $25k cash investment doubles in ~7 years — after that, you're playing with house money.
- Climate carrying-cost: moderate flood risk; severe wind risk, 99% chance of damaging wind over 30y; extreme-heat days projected 7→25/yr by 2055 (HVAC capex compounding) — expect insurance premiums to compound above CPI over the hold.
- Cap rate 11.9% vs local median 1.8% in Pinewood Estates — top-decile yield for the area; either an underpriced asset or a hidden risk that comps aren't pricing in. Stress-test before assuming the spread holds.
Questions for listing agent
- Built in 1963 — when were the roof, HVAC, electrical panel, plumbing, and water heater last replaced?
- Property tax is high relative to price — has the assessment been appealed recently, and will the sale trigger a re-assessment?
- Is there a deadline driving the sale (1031 exchange, divorce, estate, relocation)? That informs how much negotiation room exists.
- What's the average days-on-market for RENTAL listings here right now (not sales)? A rising rental-DOM trend means longer vacancies and softer asking-rent achievability than the comps imply.
- What's the recent tenant-quality profile in this submarket — average credit score on applications, eviction rate, late-payment / NSF rate, and stable-employment percentage? A property-management company in the area should have these aggregated.
- How much new for-sale + rental construction is in the pipeline within 1–3 miles? Heavy new supply typically softens prices + rents 12–24 months out; constrained supply supports both.
CashFlowRE · CFR-863H1FEF3F74VD
· Data 3 weeks ago
cashflowre.app · 2026-05-29