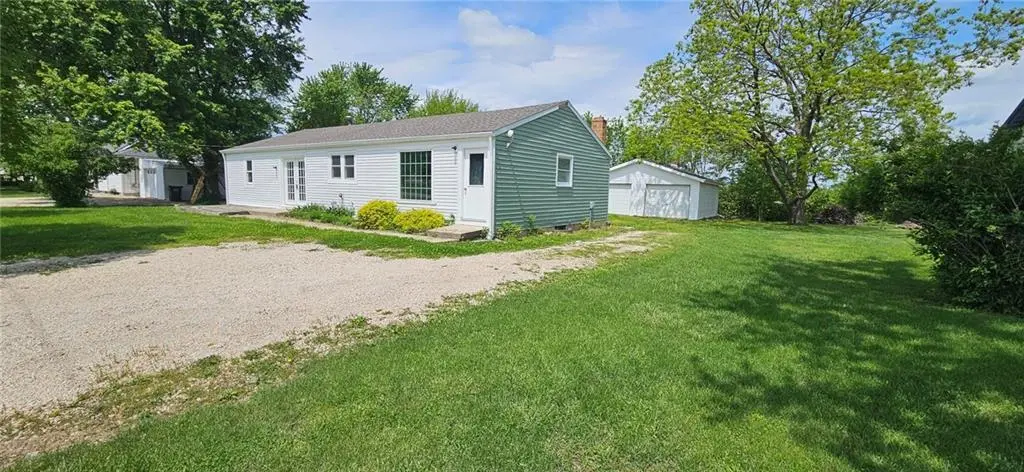
608 E 10th St
Holden, MO 64040
$119,900C+
3 bd · 2.0 ba ·
1,404 sqft ·
Built 1940
· Other
· Active
· 28 DOM
Cashflow @ list (25.0% down · 7.5%)
Estimated rent
$1,195/mo
Mortgage (P&I)
−$629
Tax + insurance
−$137
HOA
−$0
Vac / Maint / Mgmt
−$251
Net cashflow
$179/mo
Annual
$2,144/yr
Cap rate
8.08%
Cash-on-cash
6.39%
DSCR
1.28
1% rule
1.00%
Cash to close
$33,572
Investor read
- This is a 3-bed/2.0-bath other listed at $120k.
- At list price, monthly cash flow is $179 ($2k/yr) — positive.
- The deal already cash-flows at list — no discount required.
- To meet the 1% rule (rent ≥ 1% of price), the offer needs to be $120k (0.3% below list).
- It's been on market 28 days — a 2% lower offer ($118k) is reasonable based on typical stale-listing flexibility.
- Recommended offer: $118k (1.5% below list) — sets the bar for market timing.
- In year one you build about $13k of equity ($829 loan paydown + $12k appreciation (10.0% local appreciation)).
- Location reads 69/100 on livability (#167 in MO) — a middle-class / working-renter tenant base. Strengths: cost of living A+, housing A+, crime A-; Watch: employment D+, schools F, amenities F.
- Holden R-III (rural): math 33% / reading 41% proficiency, ranked #176 of 324 in MO (top 54%) — families likely to look elsewhere, expect single-tenant / working-renter base with shorter leases.
- Watch-outs: built in 1940 — expect roof / HVAC / electrical / plumbing capex.
- Market conditions: 75 active listings in the ZIP; 80 units permitted in Johnson County in 2024 (27 in 5+ unit buildings).
- Johnson County population projected at +6% by 2050 — modest demand growth; plan on rents tracking national, not racing it.
- 4 sale attempts since 16y ago; this cycle's ask has dropped $10k (8%) from the opening price — seller is motivated, your offer sets the floor, not the list.
- At projected returns (10.0% appreciation + 3.0% rent growth), your $34k cash investment doubles in ~3 years — after that, you're playing with house money.
- By year 3, paydown + projected appreciation supports a ~$32k cash-out refi (75% LTV) — recoverable capital for the next deal without selling this one.
- Cap rate 8.1% vs local median 2.6% in Holden — top-decile yield for the area; either an underpriced asset or a hidden risk that comps aren't pricing in. Stress-test before assuming the spread holds.
Questions for listing agent
- Built in 1940 — when were the roof, HVAC, electrical panel, plumbing, and water heater last replaced?
- Is there a deadline driving the sale (1031 exchange, divorce, estate, relocation)? That informs how much negotiation room exists.
- Schools are F-rated, which usually means shorter tenancies and higher turnover. Who's the typical renter profile here, and what's been the actual vacancy rate?
- What's the average days-on-market for RENTAL listings here right now (not sales)? A rising rental-DOM trend means longer vacancies and softer asking-rent achievability than the comps imply.
- What's the recent tenant-quality profile in this submarket — average credit score on applications, eviction rate, late-payment / NSF rate, and stable-employment percentage? A property-management company in the area should have these aggregated.
- How much new for-sale + rental construction is in the pipeline within 1–3 miles? Heavy new supply typically softens prices + rents 12–24 months out; constrained supply supports both.
CashFlowRE · CFR-869RTC2MB79W5V
· Data 2 days ago
cashflowre.app · 2026-05-29