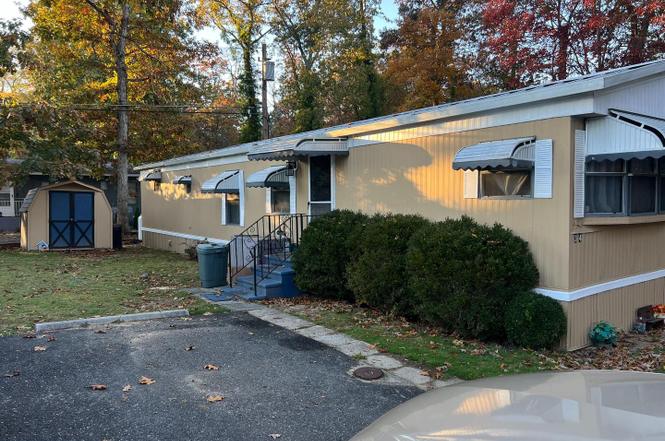
576 W Forest Grove Rd Lot 34
Vineland, NJ 08360
$55,000B-
2 bd · 1.0 ba ·
648 sqft ·
Built 1985
· SingleFamily
· Active
· 208 DOM
Cashflow @ list (25.0% down · 7.5%)
Estimated rent
$1,580/mo
Mortgage (P&I)
−$288
Tax + insurance
−$92
HOA
−$585
Vac / Maint / Mgmt
−$332
Net cashflow
$283/mo
Annual
$3,399/yr
Cap rate
12.47%
Cash-on-cash
22.07%
DSCR
1.98
1% rule
2.87%
Cash to close
$15,400
Investor read
- This is a 2-bed/1.0-bath single-family listed at $55k.
- At list price, monthly cash flow is $283 ($3k/yr) — positive.
- The deal already cash-flows at list — no discount required.
- Meets the 1% rule at list price ($2k rent vs $55k).
- It's been on market 208 days — a 12% lower offer ($48k) is reasonable based on typical stale-listing flexibility.
- Recommended offer: $48k (12.0% below list) — sets the bar for market timing.
- Local home prices are declining (-3.0%/yr); year-one equity from $380 of loan paydown is wiped out by about $2k of value loss. Plan a longer hold.
- Location reads 66/100 on livability (#363 in NJ) — a middle-class / working-renter tenant base. Strengths: housing A+, health & safety A+; Watch: employment D+, crime F, amenities F.
- Vineland Public School District (urban): math 9% / reading 34% proficiency, ranked #418 of 472 in NJ (top 89%) — low school quality limits family demand, transient renter base, plan for 1-2y turnover.
- Zoned schools: Marie Durand Elementary School (math 6% / reading 34%, grade F, #990 of 1,303 statewide, top 76%, 475 students, 1% FRL); Thomas W. Wallace Jr. Middle School (math 5% / reading 29%, grade F, #409 of 431 statewide, top 95%, 778 students, 0% FRL); Vineland Senior High School (math 10% / reading 34%, grade F, #346 of 399 statewide, top 88%, 2,780 students, 0% FRL) — zoned schools average 0% FRL vs 53% district-wide (53 pts lower); this property's tenant base skews higher-income than the district average.
- Watch-outs: HOA is 37% of rent.
- Market conditions: 176 active listings in the ZIP; 216 units permitted in Cumberland County in 2024 (73 in 5+ unit buildings).
- Cumberland County population projected to shrink 7% by 2050 — rents likely to lag national; underwrite the cash flow, not the appreciation.
- 2 sale attempts with the ask held roughly flat each time — persistent listings suggest the price (not the market) is what's stuck; bring a comps-based counter.
- At projected returns (-3.0% appreciation + 3.0% rent growth), your $15k cash investment doubles in ~6 years — after that, you're playing with house money.
- Cap rate 12.5% vs local median 4.5% in Vineland — top-decile yield for the area; either an underpriced asset or a hidden risk that comps aren't pricing in. Stress-test before assuming the spread holds.
Questions for listing agent
- It's been on market 208 days. Have you received any prior offers? Is the seller open to a 12% concession, seller financing, or rate buy-down credit?
- What does the HOA fee cover, when was the last increase, and are there any pending special assessments or reserve-fund shortfalls?
- Why hasn't it sold? Are there any deal-killer items the seller is aware of (foundation, flood, title, zoning, code violations)?
- Is there a deadline driving the sale (1031 exchange, divorce, estate, relocation)? That informs how much negotiation room exists.
- Schools are D-rated, which usually means shorter tenancies and higher turnover. Who's the typical renter profile here, and what's been the actual vacancy rate?
- Crime grade is F in this area — have there been break-ins, vandalism, or insurance claims at this property in the last 3 years? What carrier currently insures it and at what premium?
- What's the average days-on-market for RENTAL listings here right now (not sales)? A rising rental-DOM trend means longer vacancies and softer asking-rent achievability than the comps imply.
- What's the recent tenant-quality profile in this submarket — average credit score on applications, eviction rate, late-payment / NSF rate, and stable-employment percentage? A property-management company in the area should have these aggregated.
CashFlowRE · CFR-86ZEPZA0GNWX0G
· Data 14 h ago
cashflowre.app · 2026-05-29