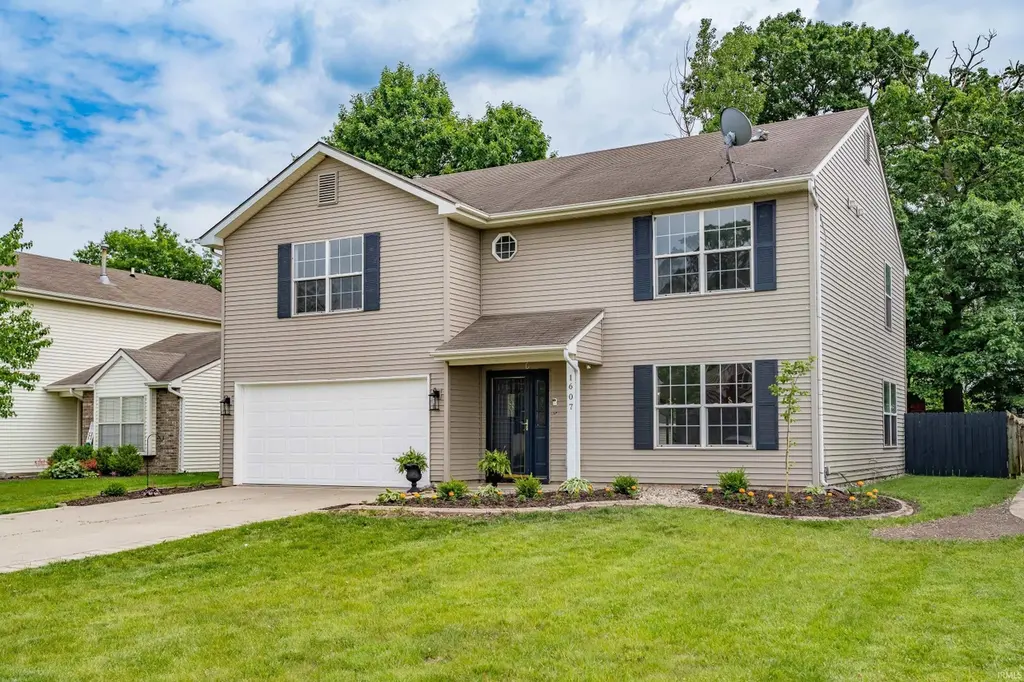
1607 Bear Claw Ln
Huntertown, IN 46845
$299,900D+
4 bd · 2.5 ba ·
2,332 sqft ·
Built 2001
· SingleFamily
· Active
· 20 DOM
Cashflow @ list (25.0% down · 7.5%)
Estimated rent
$2,321/mo
Mortgage (P&I)
−$1,573
Tax + insurance
−$302
HOA
−$12
Vac / Maint / Mgmt
−$488
Net cashflow
$-53/mo
Annual
$-638/yr
Cap rate
6.08%
Cash-on-cash
-0.76%
DSCR
0.97
1% rule
0.77%
Cash to close
$83,972
Investor read
- This is a 4-bed/2.5-bath single-family listed at $300k.
- At list price, monthly cash flow is $-53 ($-638/yr) — negative.
- To cash-flow at today's rent, offer at most $291k (3.1% below list).
- To meet the 1% rule (rent ≥ 1% of price), the offer needs to be $232k (22.6% below list).
- It's been on market 20 days — a 2% lower offer ($295k) is reasonable based on typical stale-listing flexibility.
- Recommended offer: $232k (22.6% below list) — sets the bar for 1% rule.
- Local home prices are declining (-3.0%/yr); year-one equity from $2k of loan paydown is wiped out by about $9k of value loss. Plan a longer hold.
- Location reads 70/100 on livability (#159 in IN) — a middle-class / working-renter tenant base. Strengths: employment A+, cost of living A+, housing A+; Watch: amenities F, commute F, health & safety F.
- Northwest Allen County Schools (rural): math 51% / reading 58% proficiency, ranked #25 of 301 in IN (top 8%) — acceptable for families but not a draw, mixed tenant base, ~2y average lease; only 11% free/reduced lunch — higher-income household profile.
- Zoned schools: Huntertown Elementary School (math 44% / reading 36%, grade F, #494 of 994 statewide, top 50%, 506 students, 38% FRL); Carroll Middle School (math 39% / reading 55%, grade D+, #65 of 330 statewide, top 21%, 994 students, 29% FRL); Carroll High School (math 59% / reading 86%, grade B+, #10 of 369 statewide, top 3%, 2,554 students, 21% FRL) — zoned schools average 29% FRL vs 11% district-wide (18 pts higher); higher-poverty schools than district average — tighter screening recommended.
- Market conditions: Rents rising fast (+10.5%/yr); 227 active listings in the ZIP; 1 comparable units currently listed for rent nearby; high-income renter base; 1,861 units permitted in Allen County in 2024 (576 in 5+ unit buildings).
- Allen County population projected at +10% by 2050 — modest demand growth; plan on rents tracking national, not racing it.
- 2 sale attempts since 5y ago with the ask held roughly flat each time — persistent listings suggest the price (not the market) is what's stuck; bring a comps-based counter.
- Current owner paid $248k; 21% above their basis — modest negotiation headroom, anchor on the comps not their cost.
- Cap rate 6.1% vs local median 4.1% in Huntertown — top-decile yield for the area; either an underpriced asset or a hidden risk that comps aren't pricing in. Stress-test before assuming the spread holds.
Questions for listing agent
- What do current leases actually rent for vs. the listed asking? Can we see a recent rent roll and the last 12 months of T-12 income?
- What does the HOA fee cover, when was the last increase, and are there any pending special assessments or reserve-fund shortfalls?
- Is there a deadline driving the sale (1031 exchange, divorce, estate, relocation)? That informs how much negotiation room exists.
- The area grade is low — what's the realistic commute time and amenity access for the typical tenant pool here? Any planned neighborhood developments (good or bad) we should know about?
- What's the average days-on-market for RENTAL listings here right now (not sales)? A rising rental-DOM trend means longer vacancies and softer asking-rent achievability than the comps imply.
- What's the recent tenant-quality profile in this submarket — average credit score on applications, eviction rate, late-payment / NSF rate, and stable-employment percentage? A property-management company in the area should have these aggregated.
- How much new for-sale + rental construction is in the pipeline within 1–3 miles? Heavy new supply typically softens prices + rents 12–24 months out; constrained supply supports both.
CashFlowRE · CFR-891HEADQHTN5V2
· Data 4 h ago
cashflowre.app · 2026-05-29