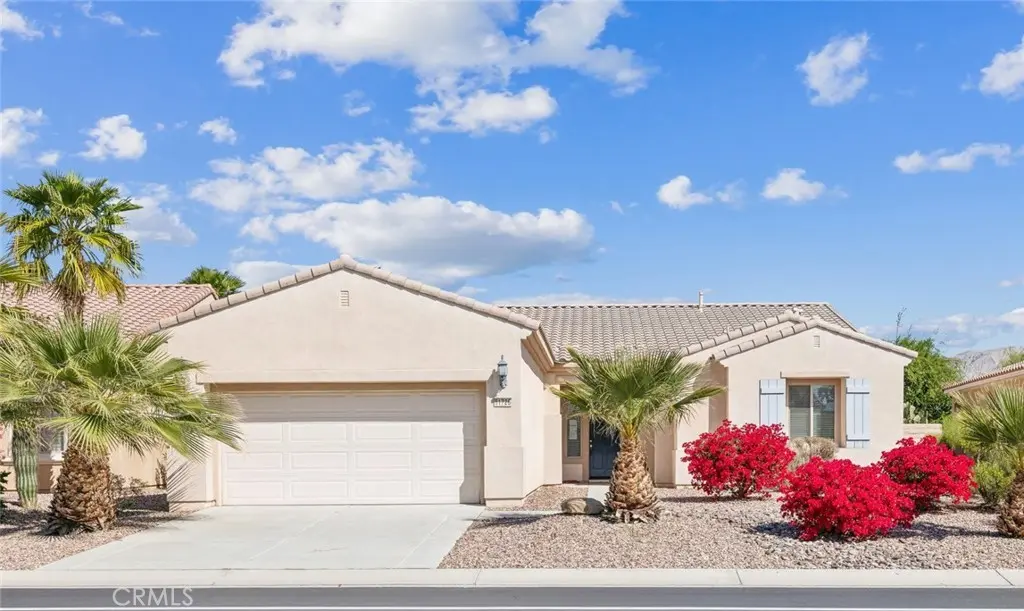
81726 Avenida Sombra
Indio, CA 92203
$380,000D+
2 bd · 2.0 ba ·
1,854 sqft ·
Built 2007
· SingleFamily
· Active
· 280 DOM
Cashflow @ list (25.0% down · 7.5%)
Estimated rent
$3,727/mo
Mortgage (P&I)
−$1,993
Tax + insurance
−$712
HOA
−$346
Vac / Maint / Mgmt
−$783
Net cashflow
$-107/mo
Annual
$-1,279/yr
Cap rate
5.96%
Cash-on-cash
-1.20%
DSCR
0.95
1% rule
0.98%
Cash to close
$106,400
Investor read
- This is a 2-bed/2.0-bath single-family listed at $380k.
- At list price, monthly cash flow is $-107 ($-1k/yr) — negative.
- To cash-flow at today's rent, offer at most $361k (5.0% below list).
- To meet the 1% rule (rent ≥ 1% of price), the offer needs to be $373k (1.9% below list).
- It's been on market 280 days — a 12% lower offer ($334k) is reasonable based on typical stale-listing flexibility.
- Recommended offer: $334k (12.0% below list) — sets the bar for market timing.
- Local home prices are declining (-3.0%/yr); year-one equity from $3k of loan paydown is wiped out by about $11k of value loss. Plan a longer hold.
- Location reads 53/100 on livability (#927 in CA) — a working-class tenant base; expect higher turnover. Strengths: housing B+; Watch: employment D, schools F, crime F.
- Desert Sands Unified (suburban): math 31% / reading 56% proficiency, ranked #199 of 517 in CA (top 38%) — families likely to look elsewhere, expect single-tenant / working-renter base with shorter leases.
- Market conditions: Rents rising fast (+11.6%/yr); 441 active listings in the ZIP; 40 comparable units currently listed for rent nearby; rentals lingering (median 44d on market — plan ~5-8 weeks vacancy on turnover, expect pricing pressure); 65% of comp listings sitting > 30 days — soft ceiling on asking rent; solid renter incomes; 9,195 units permitted in Riverside County in 2024 (1,512 in 5+ unit buildings).
- Riverside County population projected at +22% by 2050 — long-run rental-demand tailwind backs the buy-and-hold thesis.
- 5 sale attempts since 2y ago; this cycle's ask has dropped $45k (11%) from the opening price — seller is motivated, your offer sets the floor, not the list.
- Climate carrying-cost: major wildfire risk; extreme-heat days projected 6→16/yr by 2055 (HVAC capex compounding) — expect insurance premiums to compound above CPI over the hold.
- Cap rate 6.0% vs local median 4.3% in Indio — top-decile yield for the area; either an underpriced asset or a hidden risk that comps aren't pricing in. Stress-test before assuming the spread holds.
- At $3,727/mo this rent would consume 46% of the median local household income ($97k/yr) (locally 565% of renters already pay >50% of income on rent) — very limited rent-growth headroom before tenants either downsize or default.
Questions for listing agent
- What do current leases actually rent for vs. the listed asking? Can we see a recent rent roll and the last 12 months of T-12 income?
- It's been on market 280 days. Have you received any prior offers? Is the seller open to a 12% concession, seller financing, or rate buy-down credit?
- What does the HOA fee cover, when was the last increase, and are there any pending special assessments or reserve-fund shortfalls?
- Why hasn't it sold? Are there any deal-killer items the seller is aware of (foundation, flood, title, zoning, code violations)?
- Is there a deadline driving the sale (1031 exchange, divorce, estate, relocation)? That informs how much negotiation room exists.
- Schools are F-rated, which usually means shorter tenancies and higher turnover. Who's the typical renter profile here, and what's been the actual vacancy rate?
- Crime grade is F in this area — have there been break-ins, vandalism, or insurance claims at this property in the last 3 years? What carrier currently insures it and at what premium?
- The area grade is low — what's the realistic commute time and amenity access for the typical tenant pool here? Any planned neighborhood developments (good or bad) we should know about?
CashFlowRE · CFR-899KAM9C921RKS
· Data 2 days ago
cashflowre.app · 2026-05-29