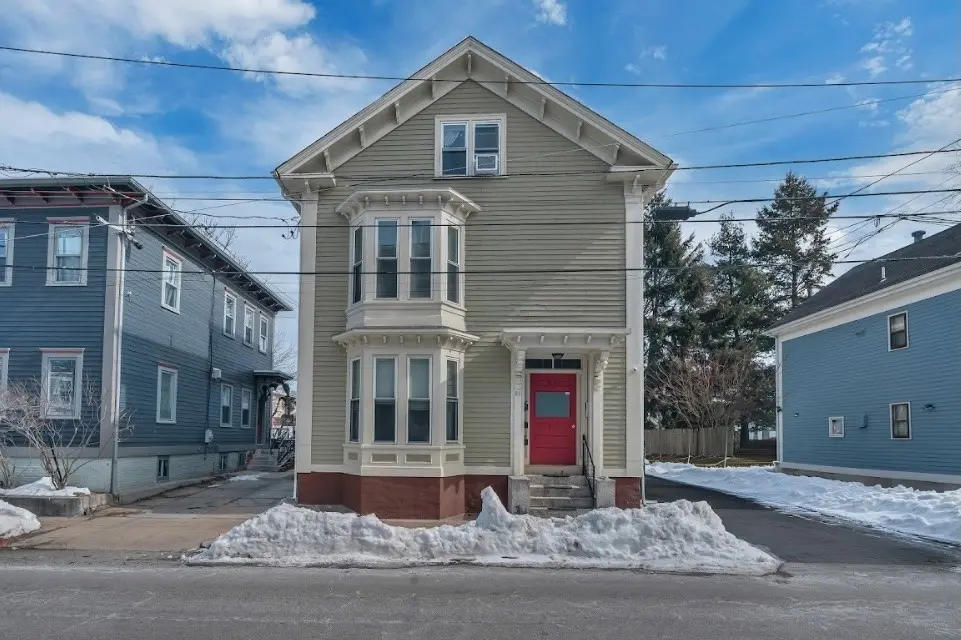
86 Tobey St
Providence, RI 02909
$775,000C-
13 bd · 5.0 ba ·
3,676 sqft ·
Built 1930
· MultiFamily
· Active
· 107 DOM
Cashflow @ list (25.0% down · 7.5%)
Estimated rent
$8,827/mo
Mortgage (P&I)
−$4,064
Tax + insurance
−$1,282
HOA
−$0
Vac / Maint / Mgmt
−$1,854
Net cashflow
$1,627/mo
Annual
$19,524/yr
Cap rate
8.81%
Cash-on-cash
9.00%
DSCR
1.40
1% rule
1.14%
Cash to close
$217,000
Investor read
- This is a 3 × 4-bed/1.7-bath units multifamily listed at $775k.
- At list price, monthly cash flow is $2k ($20k/yr) — positive. Per door: $542/mo.
- The deal already cash-flows at list — no discount required.
- Meets the 1% rule at list price ($9k rent vs $775k).
- It's been on market 107 days — a 9% lower offer ($705k) is reasonable based on typical stale-listing flexibility.
- Recommended offer: $705k (9.0% below list) — sets the bar for market timing.
- Local home prices are declining (-3.0%/yr); year-one equity from $5k of loan paydown is wiped out by about $23k of value loss. Plan a longer hold.
- Location reads 84/100 on livability (#2 in RI, #794 nationally) — a professional / high-income tenant draw. Strengths: amenities A+, commute A+, housing A+; Watch: employment C-, schools F.
- Providence (urban): math 8% / reading 16% proficiency, ranked #34 of 39 in RI (top 87%) — low school quality limits family demand, transient renter base, plan for 1-2y turnover; 79% free/reduced lunch — lower-income household profile, screen leases tightly.
- Watch-outs: built in 1930 — expect roof / HVAC / electrical / plumbing capex.
- Market conditions: Rents rising (+3.7%/yr); 132 active listings in the ZIP; 776 units permitted in Providence County in 2024 (229 in 5+ unit buildings).
- Providence County population projected at +5% by 2050 — modest demand growth; plan on rents tracking national, not racing it.
- 8 sale attempts since 29y ago; this cycle's ask has dropped $65k (8%) from the opening price — seller is motivated, your offer sets the floor, not the list.
- Current owner paid $647k; 20% above their basis — modest negotiation headroom, anchor on the comps not their cost.
- Cap rate 8.8% vs local median 4.2% in Providence — top-decile yield for the area; either an underpriced asset or a hidden risk that comps aren't pricing in. Stress-test before assuming the spread holds.
- At $8,827/mo this rent would consume 164% of the median local household income ($65k/yr) (locally 2000% of renters already pay >50% of income on rent) — very limited rent-growth headroom before tenants either downsize or default.
Questions for listing agent
- It's been on market 107 days. Have you received any prior offers? Is the seller open to a 9% concession, seller financing, or rate buy-down credit?
- Can we see the unit-by-unit rent roll, current vacancy, and any below-market leases? What's the average tenancy length?
- What capital expenditures (roof, boiler, parking lot, exteriors) have been made in the last 5 years, and what's planned in the next 2?
- Built in 1930 — when were the roof, HVAC, electrical panel, plumbing, and water heater last replaced?
- Why hasn't it sold? Are there any deal-killer items the seller is aware of (foundation, flood, title, zoning, code violations)?
- Is there a deadline driving the sale (1031 exchange, divorce, estate, relocation)? That informs how much negotiation room exists.
- Schools are F-rated, which usually means shorter tenancies and higher turnover. Who's the typical renter profile here, and what's been the actual vacancy rate?
- What's the average days-on-market for RENTAL listings here right now (not sales)? A rising rental-DOM trend means longer vacancies and softer asking-rent achievability than the comps imply.
CashFlowRE · CFR-8AA2H87QP59MTS
· Data 2 days ago
cashflowre.app · 2026-05-29