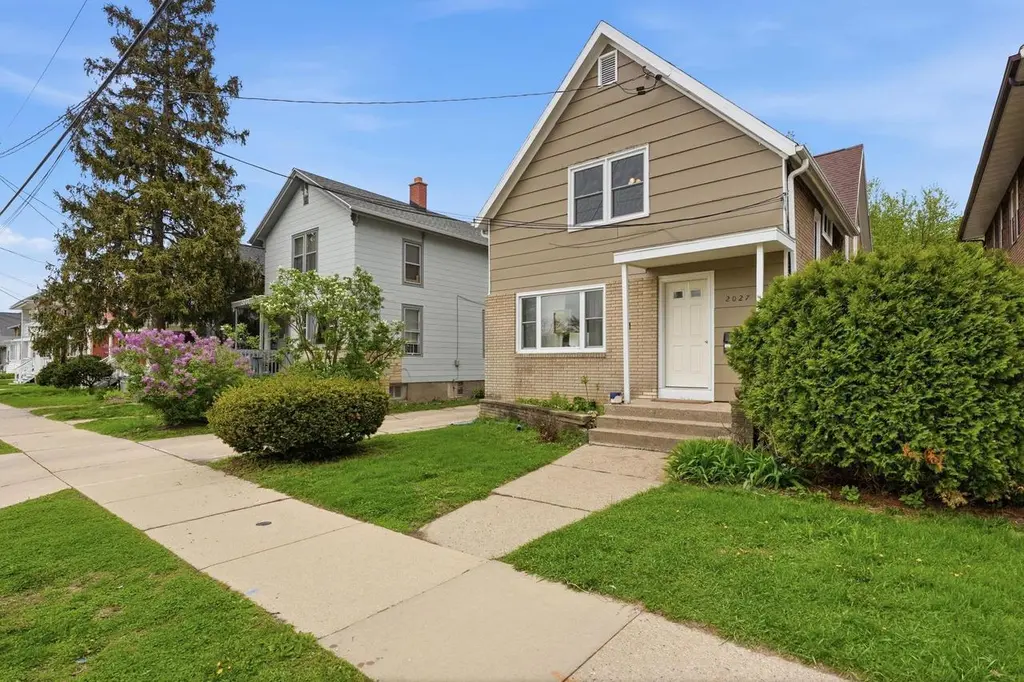
2027 E Washington Ave
Madison, WI 53704
$650,000C+
3 bd · 4.0 ba ·
2,068 sqft ·
Built 1904
· MultiFamily
· Active
· 50 DOM
Cashflow @ list (25.0% down · 7.5%)
Estimated rent
$6,812/mo
Mortgage (P&I)
−$3,409
Tax + insurance
−$966
HOA
−$0
Vac / Maint / Mgmt
−$1,431
Net cashflow
$1,007/mo
Annual
$12,082/yr
Cap rate
8.15%
Cash-on-cash
6.64%
DSCR
1.30
1% rule
1.05%
Cash to close
$182,000
Investor read
- This is a 1×2bd/1ba + 3×1bd/1ba units multifamily listed at $650k.
- At list price, monthly cash flow is $1k ($12k/yr) — positive. Per door: $252/mo.
- The deal already cash-flows at list — no discount required.
- Meets the 1% rule at list price ($7k rent vs $650k).
- It's been on market 50 days — a 3% lower offer ($630k) is reasonable based on typical stale-listing flexibility.
- Recommended offer: $630k (3.0% below list) — sets the bar for market timing.
- Local home prices are declining (-3.0%/yr); year-one equity from $4k of loan paydown is wiped out by about $20k of value loss. Plan a longer hold.
- Location reads 84/100 on livability (#39 in WI, #819 nationally) — a professional / high-income tenant draw. Strengths: commute A+, employment A+, housing A+.
- Madison Metropolitan School District (urban): math 35% / reading 40% proficiency, ranked #193 of 342 in WI (top 56%) — families likely to look elsewhere, expect single-tenant / working-renter base with shorter leases.
- Zoned schools: East High (math 32% / reading 42%, grade F, #123 of 483 statewide, top 28%, 1,649 students, 55% FRL).
- Watch-outs: built in 1904 — expect roof / HVAC / electrical / plumbing capex.
- Market conditions: Rents rising (+1.1%/yr); 141 active listings in the ZIP; 7 comparable units currently listed for rent nearby; rentals leasing fast (median 14d on market — plan ~1-2 weeks tenant-placement turnaround); 5,519 units permitted in Dane County in 2024 (3,978 in 5+ unit buildings).
- Dane County population projected at +35% by 2050 — long-run rental-demand tailwind backs the buy-and-hold thesis.
- Cap rate 8.2% vs local median 2.4% in Madison — top-decile yield for the area; either an underpriced asset or a hidden risk that comps aren't pricing in. Stress-test before assuming the spread holds.
- At $6,812/mo this rent would consume 110% of the median local household income ($74k/yr) (locally 2064% of renters already pay >50% of income on rent) — very limited rent-growth headroom before tenants either downsize or default.
Questions for listing agent
- It's been on market 50 days. Have you received any prior offers? Is the seller open to a 3% concession, seller financing, or rate buy-down credit?
- Can we see the unit-by-unit rent roll, current vacancy, and any below-market leases? What's the average tenancy length?
- What capital expenditures (roof, boiler, parking lot, exteriors) have been made in the last 5 years, and what's planned in the next 2?
- Built in 1904 — when were the roof, HVAC, electrical panel, plumbing, and water heater last replaced?
- Is there a deadline driving the sale (1031 exchange, divorce, estate, relocation)? That informs how much negotiation room exists.
- What's the average days-on-market for RENTAL listings here right now (not sales)? A rising rental-DOM trend means longer vacancies and softer asking-rent achievability than the comps imply.
- What's the recent tenant-quality profile in this submarket — average credit score on applications, eviction rate, late-payment / NSF rate, and stable-employment percentage? A property-management company in the area should have these aggregated.
- How much new apartment / multifamily construction is in the pipeline within 1–3 miles? Heavy new supply (>2% of stock underway) typically softens rents 12–24 months out; light construction supports rent growth.
CashFlowRE · CFR-8CAJBV5DJFY8JS
· Data 2 days ago
cashflowre.app · 2026-05-29