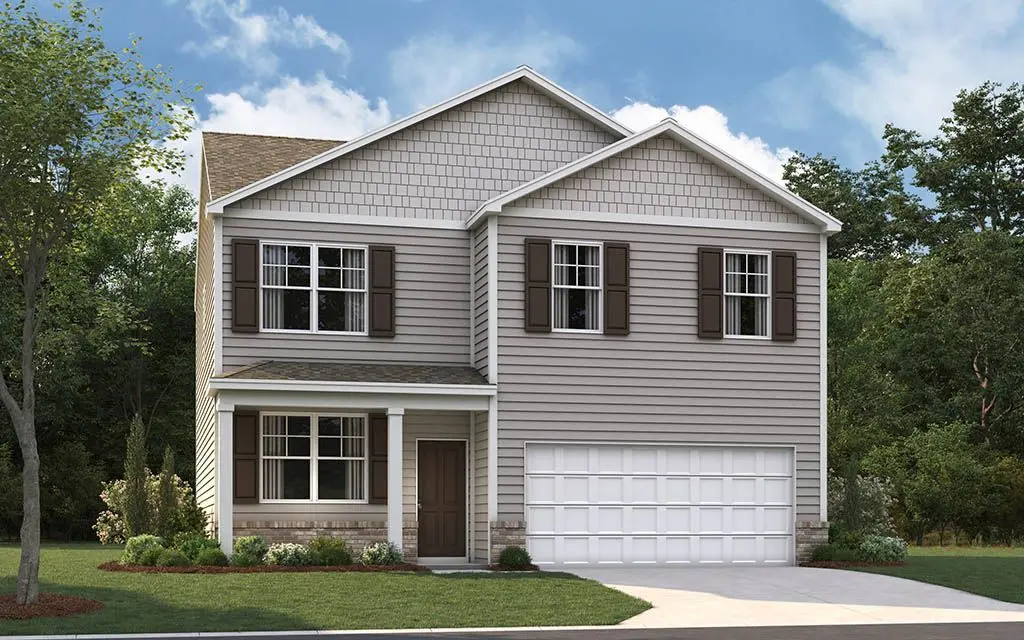
Belhaven Plan
Fairview, GA 30741
$307,990D
4 bd · 2.5 ba ·
1,991 sqft ·
Built —
· SingleFamily
· Active
· 960 DOM
Cashflow @ list (25.0% down · 7.5%)
Estimated rent
$2,643/mo
Mortgage (P&I)
−$1,640
Tax + insurance
−$521
HOA
−$0
Vac / Maint / Mgmt
−$555
Net cashflow
$-72/mo
Annual
$-869/yr
Cap rate
6.02%
Cash-on-cash
-0.99%
DSCR
0.96
1% rule
0.85%
Cash to close
$87,544
Investor read
- This is a 4-bed/2.5-bath single-family listed at $308k. Condition is rated good.
- At list price, monthly cash flow is $-72 ($-869/yr) — negative.
- To cash-flow at today's rent, offer at most $302k (1.9% below list).
- To meet the 1% rule (rent ≥ 1% of price), the offer needs to be $264k (14.2% below list).
- It's been on market 960 days — a 12% lower offer ($271k) is reasonable based on typical stale-listing flexibility.
- Recommended offer: $264k (14.2% below list) — sets the bar for 1% rule.
- Local home prices are declining (-3.0%/yr); year-one equity from $2k of loan paydown is wiped out by about $9k of value loss. Plan a longer hold.
- Location reads 58/100 on livability (#440 in GA) — a working-class tenant base; expect higher turnover. Strengths: cost of living A+, housing A+; Watch: employment D+, schools F, amenities F.
- Walker County (rural): math 25% / reading 29% proficiency, ranked #114 of 174 in GA (top 66%) — low school quality limits family demand, transient renter base, plan for 1-2y turnover; 61% free/reduced lunch — lower-income household profile, screen leases tightly.
- Market conditions: Rents rising fast (+7.4%/yr); 425 active listings in the ZIP; 7 comparable units currently listed for rent nearby; rentals at typical pace (median 14d on market — plan ~3-4 weeks tenant-placement turnaround); 347 units permitted in Walker County in 2024 (24 in 5+ unit buildings).
- Walker County population projected at -16% by 2050 — secular population decline; favor cash flow + early exit over multi-decade hold.
- Cap rate 6.0% vs local median 4.9% in Fairview — meaningfully above typical; check what's discounted (condition, days-on-market, listing class) to confirm the premium yield is real.
- At $2,643/mo this rent would consume 54% of the median local household income ($59k/yr) (locally 834% of renters already pay >50% of income on rent) — very limited rent-growth headroom before tenants either downsize or default.
Questions for listing agent
- What do current leases actually rent for vs. the listed asking? Can we see a recent rent roll and the last 12 months of T-12 income?
- It's been on market 960 days. Have you received any prior offers? Is the seller open to a 14% concession, seller financing, or rate buy-down credit?
- Why hasn't it sold? Are there any deal-killer items the seller is aware of (foundation, flood, title, zoning, code violations)?
- Is there a deadline driving the sale (1031 exchange, divorce, estate, relocation)? That informs how much negotiation room exists.
- Schools are F-rated, which usually means shorter tenancies and higher turnover. Who's the typical renter profile here, and what's been the actual vacancy rate?
- The area grade is low — what's the realistic commute time and amenity access for the typical tenant pool here? Any planned neighborhood developments (good or bad) we should know about?
- What's the average days-on-market for RENTAL listings here right now (not sales)? A rising rental-DOM trend means longer vacancies and softer asking-rent achievability than the comps imply.
- What's the recent tenant-quality profile in this submarket — average credit score on applications, eviction rate, late-payment / NSF rate, and stable-employment percentage? A property-management company in the area should have these aggregated.
CashFlowRE · CFR-8D5S6H48AVHS15
· Data 2 days ago
cashflowre.app · 2026-05-29