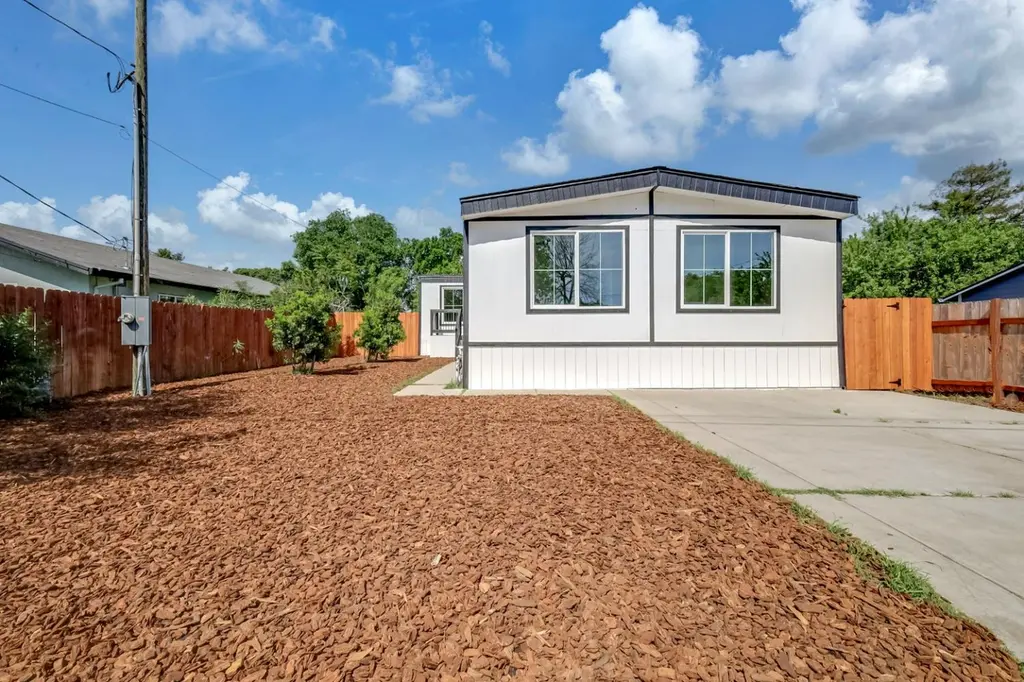
5603 S Gledhill Ave Unit E
Linda, CA 95961
$279,900C-
3 bd · 2.0 ba ·
1,788 sqft ·
Built 1977
· Manufactured
· Pending
· 38 DOM
Cashflow @ list (25.0% down · 7.5%)
Estimated rent
$2,572/mo
Mortgage (P&I)
−$1,468
Tax + insurance
−$377
HOA
−$0
Vac / Maint / Mgmt
−$540
Net cashflow
$187/mo
Annual
$2,242/yr
Cap rate
7.09%
Cash-on-cash
2.86%
DSCR
1.13
1% rule
0.92%
Cash to close
$78,372
Investor read
- This is a 3-bed/2.0-bath manufactured listed at $280k.
- At list price, monthly cash flow is $187 ($2k/yr) — positive.
- The deal already cash-flows at list — no discount required.
- To meet the 1% rule (rent ≥ 1% of price), the offer needs to be $257k (8.1% below list).
- It's been on market 38 days — a 3% lower offer ($272k) is reasonable based on typical stale-listing flexibility.
- Recommended offer: $257k (8.1% below list) — sets the bar for 1% rule.
- Local home prices are declining (-3.0%/yr); year-one equity from $2k of loan paydown is wiped out by about $8k of value loss. Plan a longer hold.
- Location reads 52/100 on livability (#995 in CA) — a working-class tenant base; expect higher turnover. Strengths: commute A+, housing A+; Watch: crime F, amenities F, employment D-.
- Marysville Joint Unified (suburban): math 14% / reading 28% proficiency, ranked #455 of 517 in CA (top 88%) — low school quality limits family demand, transient renter base, plan for 1-2y turnover; 68% free/reduced lunch — lower-income household profile, screen leases tightly.
- Zoned schools: Cedar Lane Elementary (math 4% / reading 8%, grade F, #1,563 of 1,571 statewide, top 99%, 531 students, 90% FRL); Yuba Gardens Intermediate (math 11% / reading 25%, grade F, #431 of 498 statewide, top 88%, 767 students, 82% FRL); Lindhurst High (math 17% / reading 42%, grade F, #750 of 1,170 statewide, top 66%, 1,237 students, 76% FRL).
- Market conditions: 318 active listings in the ZIP; 2 comparable units currently listed for rent nearby; solid renter incomes; 750 units permitted in Yuba County in 2024 (41 in 5+ unit buildings).
- Yuba County population projected to shrink 3% by 2050 — rents likely to lag national; underwrite the cash flow, not the appreciation.
- Current owner paid $30k; list at $280k implies a 833% gain — meaningful room to come down on a strong offer.
- Cap rate 7.1% vs local median 2.8% in Linda — top-decile yield for the area; either an underpriced asset or a hidden risk that comps aren't pricing in. Stress-test before assuming the spread holds.
- This rent runs 34% of the median local income ($90k/yr) — at the standard rent-burdened threshold; future hikes will face affordability resistance.
Questions for listing agent
- It's been on market 38 days. Have you received any prior offers? Is the seller open to a 8% concession, seller financing, or rate buy-down credit?
- Built in 1977 — when were the roof, HVAC, electrical panel, plumbing, and water heater last replaced?
- Is there a deadline driving the sale (1031 exchange, divorce, estate, relocation)? That informs how much negotiation room exists.
- Schools are F-rated, which usually means shorter tenancies and higher turnover. Who's the typical renter profile here, and what's been the actual vacancy rate?
- Crime grade is F in this area — have there been break-ins, vandalism, or insurance claims at this property in the last 3 years? What carrier currently insures it and at what premium?
- What's the average days-on-market for RENTAL listings here right now (not sales)? A rising rental-DOM trend means longer vacancies and softer asking-rent achievability than the comps imply.
- What's the recent tenant-quality profile in this submarket — average credit score on applications, eviction rate, late-payment / NSF rate, and stable-employment percentage? A property-management company in the area should have these aggregated.
- How much new for-sale + rental construction is in the pipeline within 1–3 miles? Heavy new supply typically softens prices + rents 12–24 months out; constrained supply supports both.
CashFlowRE · CFR-8EQP403KNYCHJY
· Data 1 week ago
cashflowre.app · 2026-05-29