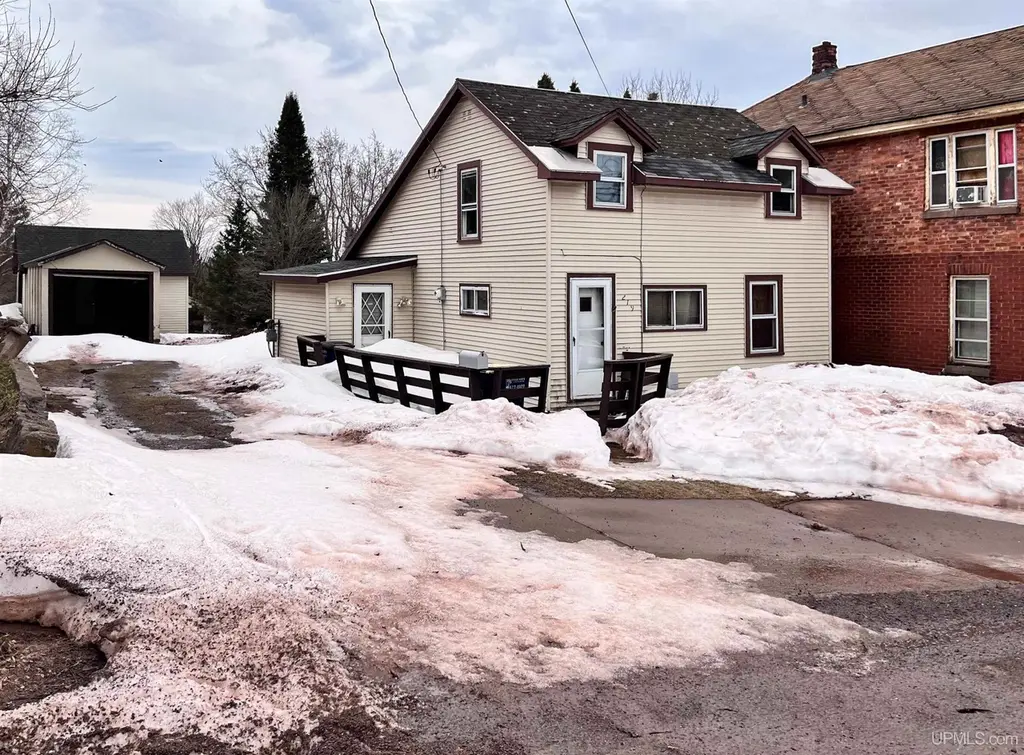
219 E Bonnie St
Ironwood, MI 49938
$46,500B-
2 bd · 1.0 ba ·
1,228 sqft ·
Built 1900
· SingleFamily
· Active
· 57 DOM
Cashflow @ list (25.0% down · 7.5%)
Estimated rent
$1,323/mo
Mortgage (P&I)
−$244
Tax + insurance
−$174
HOA
−$0
Vac / Maint / Mgmt
−$278
Net cashflow
$627/mo
Annual
$7,521/yr
Cap rate
25.70%
Cash-on-cash
69.31%
DSCR
4.08
1% rule
2.84%
Cash to close
$13,020
Investor read
- This is a 2-bed/1.0-bath single-family listed at $46k.
- At list price, monthly cash flow is $627 ($8k/yr) — positive.
- The deal already cash-flows at list — no discount required.
- Meets the 1% rule at list price ($1k rent vs $46k).
- It's been on market 57 days — a 3% lower offer ($45k) is reasonable based on typical stale-listing flexibility.
- Recommended offer: $45k (3.0% below list) — sets the bar for market timing.
- Local home prices are declining (-3.0%/yr); year-one equity from $321 of loan paydown is wiped out by about $1k of value loss. Plan a longer hold.
- Location reads 70/100 on livability (#325 in MI) — a middle-class / working-renter tenant base. Strengths: cost of living A+, crime A, housing A; Watch: health & safety C-, schools D+, amenities F.
- Ironwood Area Schools Of Gogebic County (town): math 23% / reading 40% proficiency, ranked #361 of 540 in MI (top 67%) — families likely to look elsewhere, expect single-tenant / working-renter base with shorter leases.
- Watch-outs: flood insurance adds $125/mo; built in 1900 — expect roof / HVAC / electrical / plumbing capex.
- Market conditions: 70 active listings in the ZIP; 28 units permitted in Gogebic County in 2024 (0 in 5+ unit buildings).
- Gogebic County population projected at -24% by 2050 — secular population decline; favor cash flow + early exit over multi-decade hold.
- 2 sale attempts; this cycle's ask has dropped $18k (28%) from the opening price — seller is motivated, your offer sets the floor, not the list.
- At projected returns (-3.0% appreciation + 3.0% rent growth), your $13k cash investment doubles in ~2 years — after that, you're playing with house money.
- Climate carrying-cost: in FEMA flood zone A (mandatory federal flood insurance) — expect insurance premiums to compound above CPI over the hold.
- Cap rate 25.7% vs local median 5.8% in Ironwood — top-decile yield for the area; either an underpriced asset or a hidden risk that comps aren't pricing in. Stress-test before assuming the spread holds.
Questions for listing agent
- It's been on market 57 days. Have you received any prior offers? Is the seller open to a 3% concession, seller financing, or rate buy-down credit?
- Built in 1900 — when were the roof, HVAC, electrical panel, plumbing, and water heater last replaced?
- What's the actual annual flood-insurance premium (NFIP or private), and is the property in a SFHA with mandatory coverage?
- Is there a deadline driving the sale (1031 exchange, divorce, estate, relocation)? That informs how much negotiation room exists.
- Schools are D-rated, which usually means shorter tenancies and higher turnover. Who's the typical renter profile here, and what's been the actual vacancy rate?
- What's the average days-on-market for RENTAL listings here right now (not sales)? A rising rental-DOM trend means longer vacancies and softer asking-rent achievability than the comps imply.
- What's the recent tenant-quality profile in this submarket — average credit score on applications, eviction rate, late-payment / NSF rate, and stable-employment percentage? A property-management company in the area should have these aggregated.
- How much new for-sale + rental construction is in the pipeline within 1–3 miles? Heavy new supply typically softens prices + rents 12–24 months out; constrained supply supports both.
CashFlowRE · CFR-8F1WMX8ED5CFYH
· Data 2 days ago
cashflowre.app · 2026-05-29