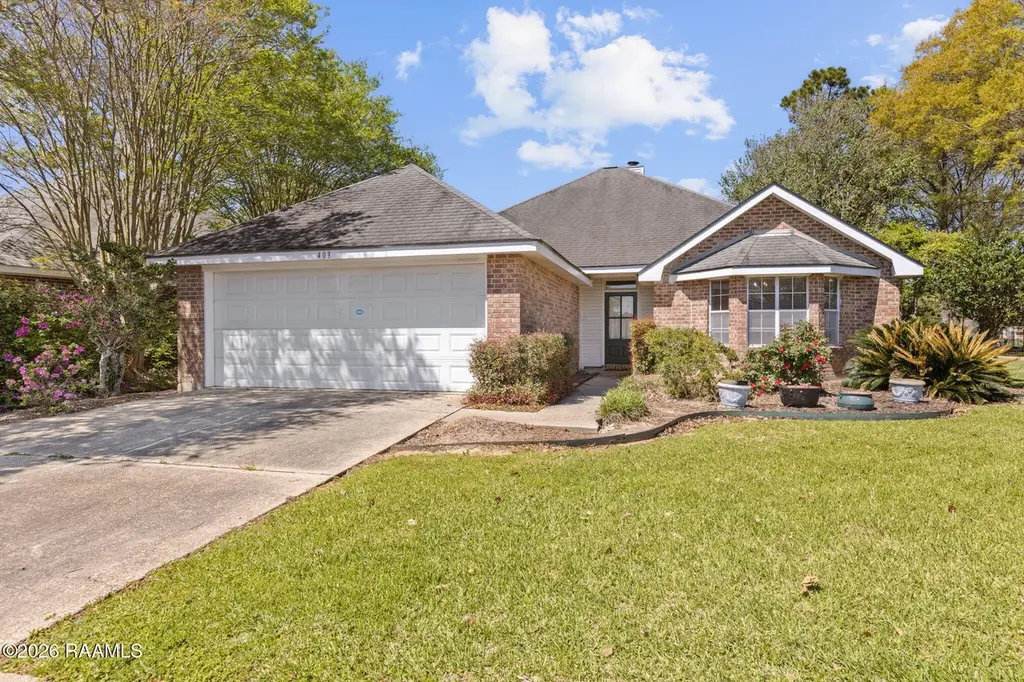
403 N Rushmore Ln
Youngsville, LA 70592
$225,000C-
3 bd · 2.0 ba ·
1,724 sqft ·
Built 1995
· SingleFamily
· Pending
· 60 DOM
Cashflow @ list (25.0% down · 7.5%)
Estimated rent
$2,136/mo
Mortgage (P&I)
−$1,180
Tax + insurance
−$259
HOA
−$35
Vac / Maint / Mgmt
−$449
Net cashflow
$214/mo
Annual
$2,568/yr
Cap rate
7.43%
Cash-on-cash
4.08%
DSCR
1.18
1% rule
0.95%
Cash to close
$63,000
Investor read
- This is a 3-bed/2.0-bath single-family listed at $225k.
- At list price, monthly cash flow is $214 ($3k/yr) — positive.
- The deal already cash-flows at list — no discount required.
- To meet the 1% rule (rent ≥ 1% of price), the offer needs to be $214k (5.1% below list).
- It's been on market 60 days — a 3% lower offer ($218k) is reasonable based on typical stale-listing flexibility.
- Recommended offer: $214k (5.1% below list) — sets the bar for 1% rule.
- Local home prices are declining (-3.0%/yr); year-one equity from $2k of loan paydown is wiped out by about $7k of value loss. Plan a longer hold.
- Location reads 78/100 on livability (#8 in LA, #2,614 nationally) — a middle-class / working-renter tenant base. Strengths: schools A+, employment A+, housing A+; Watch: amenities F, commute F.
- Lafayette Parish (urban): math 38% / reading 46% proficiency, ranked #19 of 98 in LA (top 19%) — families likely to look elsewhere, expect single-tenant / working-renter base with shorter leases.
- Market conditions: Rents rising (+1.6%/yr); 675 active listings in the ZIP; 25 comparable units currently listed for rent nearby; rentals lingering (median 44d on market — plan ~5-8 weeks vacancy on turnover, expect pricing pressure); 64% of comp listings sitting > 30 days — soft ceiling on asking rent; solid renter incomes; 1,585 units permitted in Lafayette Parish in 2024 (10 in 5+ unit buildings).
- Lafayette County population projected at +34% by 2050 — long-run rental-demand tailwind backs the buy-and-hold thesis.
- 4 sale attempts since 31y ago with the ask held roughly flat each time — persistent listings suggest the price (not the market) is what's stuck; bring a comps-based counter.
- Current owner paid $138k; list at $225k implies a 63% gain — meaningful room to come down on a strong offer.
- Climate carrying-cost: severe wind risk, 99% chance of damaging wind over 30y; extreme-heat days projected 7→22/yr by 2055 (HVAC capex compounding) — expect insurance premiums to compound above CPI over the hold.
- Cap rate 7.4% vs local median 4.8% in Youngsville — top-decile yield for the area; either an underpriced asset or a hidden risk that comps aren't pricing in. Stress-test before assuming the spread holds.
Questions for listing agent
- It's been on market 60 days. Have you received any prior offers? Is the seller open to a 5% concession, seller financing, or rate buy-down credit?
- What does the HOA fee cover, when was the last increase, and are there any pending special assessments or reserve-fund shortfalls?
- Is there a deadline driving the sale (1031 exchange, divorce, estate, relocation)? That informs how much negotiation room exists.
- Schools are A-rated — typically a magnet for longer-tenancy family renters. What's the average tenant stay here, and is there a school-zone premium baked into asking?
- What's the average days-on-market for RENTAL listings here right now (not sales)? A rising rental-DOM trend means longer vacancies and softer asking-rent achievability than the comps imply.
- What's the recent tenant-quality profile in this submarket — average credit score on applications, eviction rate, late-payment / NSF rate, and stable-employment percentage? A property-management company in the area should have these aggregated.
- How much new for-sale + rental construction is in the pipeline within 1–3 miles? Heavy new supply typically softens prices + rents 12–24 months out; constrained supply supports both.
CashFlowRE · CFR-8FF8J89TM6ACH9
· Data 1 week ago
cashflowre.app · 2026-05-29