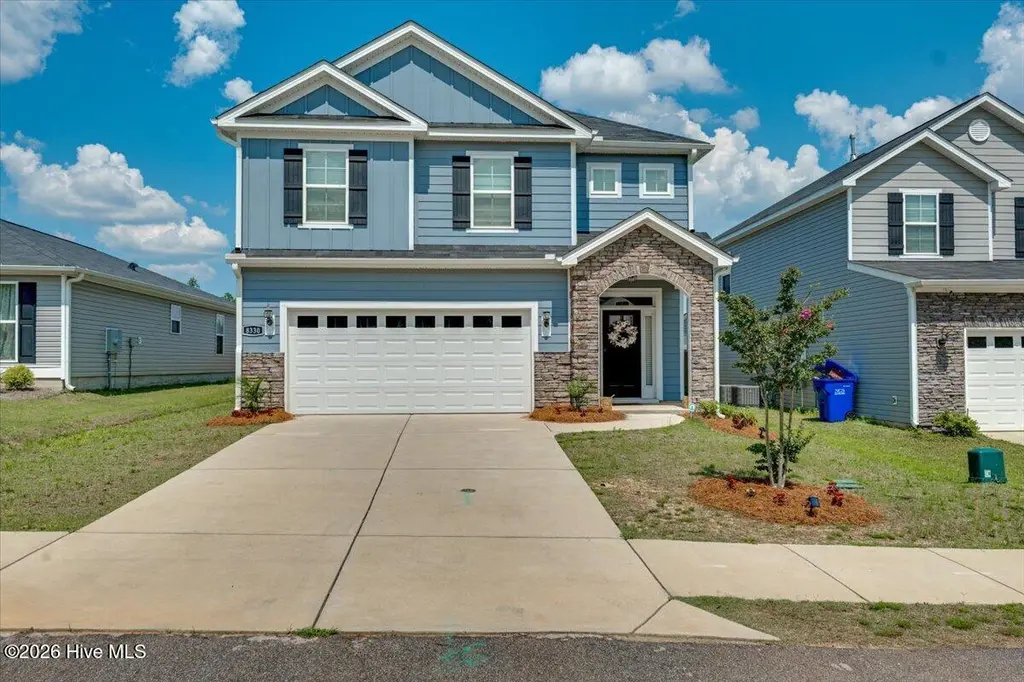
8330 Bannock Cir
Burnettown, SC 29829
$359,999D
4 bd · 2.0 ba ·
2,155 sqft ·
Built 2023
· SingleFamily
· Active
· 8 DOM
Cashflow @ list (25.0% down · 7.5%)
Estimated rent
$2,337/mo
Mortgage (P&I)
−$1,888
Tax + insurance
−$271
HOA
−$37
Vac / Maint / Mgmt
−$491
Net cashflow
$-350/mo
Annual
$-4,199/yr
Cap rate
5.13%
Cash-on-cash
-4.17%
DSCR
0.81
1% rule
0.65%
Cash to close
$100,800
Investor read
- This is a 4-bed/2.0-bath single-family listed at $360k.
- At list price, monthly cash flow is $-350 ($-4k/yr) — negative.
- To cash-flow at today's rent, offer at most $298k (17.2% below list).
- To meet the 1% rule (rent ≥ 1% of price), the offer needs to be $234k (35.1% below list).
- Only 8 days on market — expect competitive offers; lowballing is unlikely to land.
- Recommended offer: $234k (35.1% below list) — sets the bar for 1% rule.
- In year one you build about $33k of equity ($2k loan paydown + $30k appreciation (8.4% local appreciation)).
- Location reads 64/100 on livability (#159 in SC) — a middle-class / working-renter tenant base. Strengths: crime A+, cost of living A+, housing A+; Watch: amenities F, commute F, employment D-.
- Aiken 01 (suburban): math 31% / reading 44% proficiency, ranked #36 of 80 in SC (top 45%) — families likely to look elsewhere, expect single-tenant / working-renter base with shorter leases.
- Zoned schools: Clearwater Elementary (math 42% / reading 47%, grade F, #226 of 597 statewide, top 40%, 370 students, 100% FRL); Langley-Bath-Clearwater Middle (math 25% / reading 35%, grade F, #136 of 229 statewide, top 60%, 634 students, 100% FRL); Midland Valley High (math 31% / reading 83%, grade C, #120 of 196 statewide, top 64%, 1,477 students, 62% FRL) — zoned schools average 87% FRL vs 54% district-wide (33 pts higher); higher-poverty schools than district average — tighter screening recommended.
- Market conditions: 298 active listings in the ZIP; 1 comparable units currently listed for rent nearby; solid renter incomes; 2,500 units permitted in Aiken County in 2024 (1,023 in 5+ unit buildings).
- Aiken County population projected at +9% by 2050 — modest demand growth; plan on rents tracking national, not racing it.
- 7 sale attempts since 3y ago with the ask held roughly flat each time — persistent listings suggest the price (not the market) is what's stuck; bring a comps-based counter.
- By year 2, paydown + projected appreciation supports a ~$52k cash-out refi (75% LTV) — recoverable capital for the next deal without selling this one.
- This rent runs 33% of the median local income ($84k/yr) — at the standard rent-burdened threshold; future hikes will face affordability resistance.
Questions for listing agent
- What do current leases actually rent for vs. the listed asking? Can we see a recent rent roll and the last 12 months of T-12 income?
- What does the HOA fee cover, when was the last increase, and are there any pending special assessments or reserve-fund shortfalls?
- Is there a deadline driving the sale (1031 exchange, divorce, estate, relocation)? That informs how much negotiation room exists.
- Schools are D-rated, which usually means shorter tenancies and higher turnover. Who's the typical renter profile here, and what's been the actual vacancy rate?
- The area grade is low — what's the realistic commute time and amenity access for the typical tenant pool here? Any planned neighborhood developments (good or bad) we should know about?
- What's the average days-on-market for RENTAL listings here right now (not sales)? A rising rental-DOM trend means longer vacancies and softer asking-rent achievability than the comps imply.
- What's the recent tenant-quality profile in this submarket — average credit score on applications, eviction rate, late-payment / NSF rate, and stable-employment percentage? A property-management company in the area should have these aggregated.
- How much new for-sale + rental construction is in the pipeline within 1–3 miles? Heavy new supply typically softens prices + rents 12–24 months out; constrained supply supports both.
CashFlowRE · CFR-8FFH8BBVD9RKH1
· Data 22 h ago
cashflowre.app · 2026-05-29