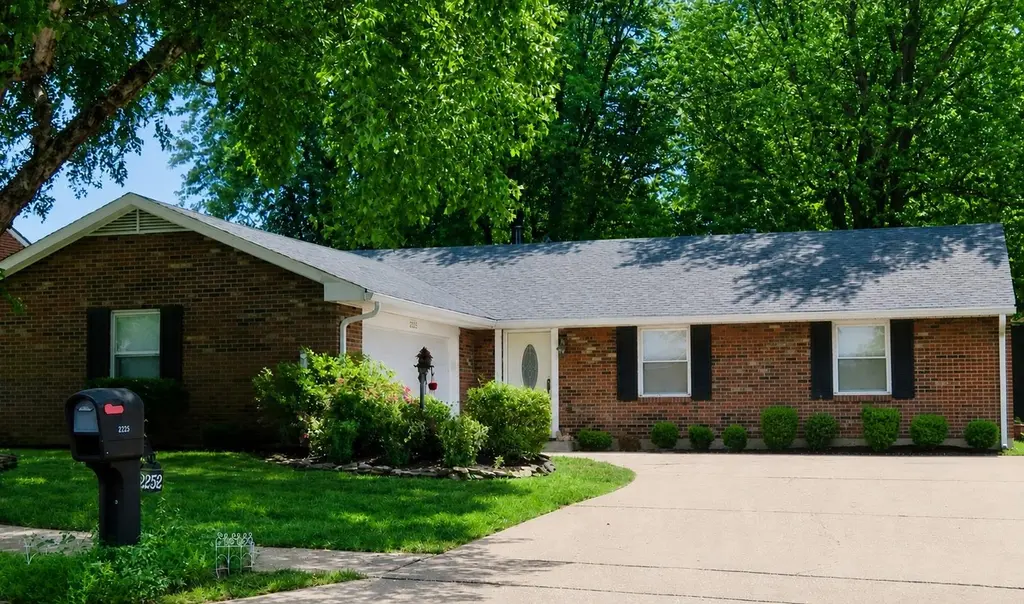
2252 Southeastern Pkwy
Owensboro, KY 42303
$199,000D+
3 bd · 2.0 ba ·
1,710 sqft ·
Built 1979
· SingleFamily
· Pending
· 1 DOM
Cashflow @ list (25.0% down · 7.5%)
Estimated rent
$1,586/mo
Mortgage (P&I)
−$1,044
Tax + insurance
−$215
HOA
−$0
Vac / Maint / Mgmt
−$333
Net cashflow
$-5/mo
Annual
$-65/yr
Cap rate
6.26%
Cash-on-cash
-0.12%
DSCR
0.99
1% rule
0.80%
Cash to close
$55,720
Investor read
- This is a 3-bed/2.0-bath single-family listed at $199k.
- At list price, monthly cash flow is $-5 ($-65/yr) — negative.
- To cash-flow at today's rent, offer at most $198k (0.5% below list).
- To meet the 1% rule (rent ≥ 1% of price), the offer needs to be $159k (20.3% below list).
- Only 1 days on market — expect competitive offers; lowballing is unlikely to land.
- Recommended offer: $159k (20.3% below list) — sets the bar for 1% rule.
- Local home prices are declining (-3.0%/yr); year-one equity from $1k of loan paydown is wiped out by about $6k of value loss. Plan a longer hold.
- Location reads 71/100 on livability (#148 in KY) — a middle-class / working-renter tenant base. Strengths: cost of living A+, housing A+, health & safety B; Watch: employment D+, crime D-, amenities F.
- Daviess County (suburban): math 33% / reading 41% proficiency, ranked #43 of 165 in KY (top 26%) — families likely to look elsewhere, expect single-tenant / working-renter base with shorter leases.
- Zoned schools: Highland Elementary School (math 50% / reading 51%, grade D+, #95 of 676 statewide, top 14%, 474 students, 44% FRL); Daviess County Middle School (math 38% / reading 53%, grade D+, #32 of 217 statewide, top 15%, 813 students, 55% FRL); Daviess County High School (math 40% / reading 41%, grade F, #37 of 254 statewide, top 15%, 1,740 students, 42% FRL) — zoned schools at 47% FRL track the district average.
- Market conditions: 366 active listings in the ZIP; 1 comparable units currently listed for rent nearby; 226 units permitted in Daviess County in 2024 (6 in 5+ unit buildings).
- Daviess County population projected at +6% by 2050 — modest demand growth; plan on rents tracking national, not racing it.
- Climate carrying-cost: extreme-heat days projected 7→19/yr by 2055 (HVAC capex compounding) — expect insurance premiums to compound above CPI over the hold.
- Cap rate 6.3% vs local median 3.1% in Owensboro — top-decile yield for the area; either an underpriced asset or a hidden risk that comps aren't pricing in. Stress-test before assuming the spread holds.
Questions for listing agent
- What do current leases actually rent for vs. the listed asking? Can we see a recent rent roll and the last 12 months of T-12 income?
- Built in 1979 — when were the roof, HVAC, electrical panel, plumbing, and water heater last replaced?
- Is there a deadline driving the sale (1031 exchange, divorce, estate, relocation)? That informs how much negotiation room exists.
- Crime grade is D in this area — have there been break-ins, vandalism, or insurance claims at this property in the last 3 years? What carrier currently insures it and at what premium?
- The area grade is low — what's the realistic commute time and amenity access for the typical tenant pool here? Any planned neighborhood developments (good or bad) we should know about?
- What's the average days-on-market for RENTAL listings here right now (not sales)? A rising rental-DOM trend means longer vacancies and softer asking-rent achievability than the comps imply.
- What's the recent tenant-quality profile in this submarket — average credit score on applications, eviction rate, late-payment / NSF rate, and stable-employment percentage? A property-management company in the area should have these aggregated.
- How much new for-sale + rental construction is in the pipeline within 1–3 miles? Heavy new supply typically softens prices + rents 12–24 months out; constrained supply supports both.
CashFlowRE · CFR-8HB1ABFV5H2MZ3
· Data 4 weeks ago
cashflowre.app · 2026-05-29