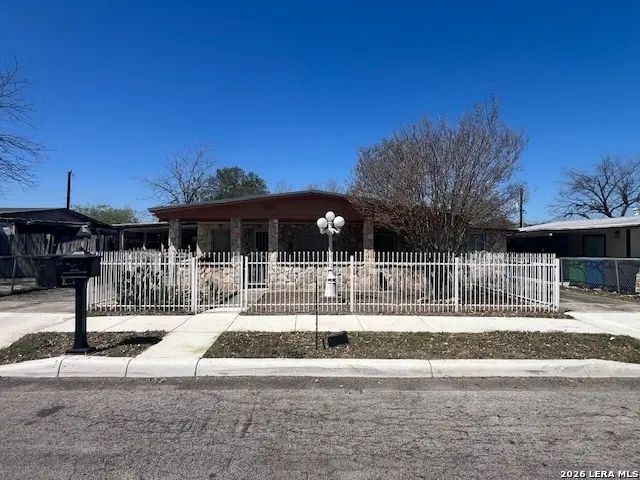
219 SW 37th
San Antonio, TX 78237
$165,000D+
3 bd · 1.0 ba ·
1,688 sqft ·
Built 1962
· SingleFamily
· Active
· 59 DOM
Cashflow @ list (25.0% down · 7.5%)
Estimated rent
$1,514/mo
Mortgage (P&I)
−$865
Tax + insurance
−$352
HOA
−$0
Vac / Maint / Mgmt
−$318
Net cashflow
$-21/mo
Annual
$-255/yr
Cap rate
6.14%
Cash-on-cash
-0.55%
DSCR
0.98
1% rule
0.92%
Cash to close
$46,200
Investor read
- This is a 3-bed/1.0-bath single-family listed at $165k.
- At list price, monthly cash flow is $-21 ($-255/yr) — negative.
- To cash-flow at today's rent, offer at most $161k (2.3% below list).
- To meet the 1% rule (rent ≥ 1% of price), the offer needs to be $151k (8.3% below list).
- It's been on market 59 days — a 3% lower offer ($160k) is reasonable based on typical stale-listing flexibility.
- Recommended offer: $151k (8.3% below list) — sets the bar for 1% rule.
- In year one you build about $18k of equity ($1k loan paydown + $16k appreciation (10.0% local appreciation)).
- Location reads 80/100 on livability (#31 in TX, #1,616 nationally) — a professional / high-income tenant draw. Strengths: amenities A+, commute A+, cost of living A+; Watch: schools C-, crime F.
- Edgewood ISD (urban): math 12% / reading 21% proficiency, ranked #812 of 826 in TX (top 98%) — low school quality limits family demand, transient renter base, plan for 1-2y turnover.
- Market conditions: Rents rising fast (+6.1%/yr); 127 active listings in the ZIP; 1 comparable units currently listed for rent nearby; lower-income renter base — watch delinquency; 8,308 units permitted in Bexar County in 2024 (2,506 in 5+ unit buildings).
- Bexar County population projected at +50% by 2050 — long-run rental-demand tailwind backs the buy-and-hold thesis.
- At projected returns (10.0% appreciation + 6.1% rent growth), your $46k cash investment doubles in ~3 years — after that, you're playing with house money.
- By year 3, paydown + projected appreciation supports a ~$45k cash-out refi (75% LTV) — recoverable capital for the next deal without selling this one.
- Climate carrying-cost: major wind risk, 77% chance of damaging wind over 30y; extreme-heat days projected 7→22/yr by 2055 (HVAC capex compounding) — expect insurance premiums to compound above CPI over the hold.
- Cap rate 6.1% vs local median 3.8% in San Antonio — top-decile yield for the area; either an underpriced asset or a hidden risk that comps aren't pricing in. Stress-test before assuming the spread holds.
- This rent runs 42% of the median local income ($43k/yr) — at the standard rent-burdened threshold; future hikes will face affordability resistance.
Questions for listing agent
- What do current leases actually rent for vs. the listed asking? Can we see a recent rent roll and the last 12 months of T-12 income?
- It's been on market 59 days. Have you received any prior offers? Is the seller open to a 8% concession, seller financing, or rate buy-down credit?
- Built in 1962 — when were the roof, HVAC, electrical panel, plumbing, and water heater last replaced?
- Is there a deadline driving the sale (1031 exchange, divorce, estate, relocation)? That informs how much negotiation room exists.
- Crime grade is F in this area — have there been break-ins, vandalism, or insurance claims at this property in the last 3 years? What carrier currently insures it and at what premium?
- The area grade is low — what's the realistic commute time and amenity access for the typical tenant pool here? Any planned neighborhood developments (good or bad) we should know about?
- What's the average days-on-market for RENTAL listings here right now (not sales)? A rising rental-DOM trend means longer vacancies and softer asking-rent achievability than the comps imply.
- What's the recent tenant-quality profile in this submarket — average credit score on applications, eviction rate, late-payment / NSF rate, and stable-employment percentage? A property-management company in the area should have these aggregated.
CashFlowRE · CFR-8JFQE9CT8R15CS
· Data 2 days ago
cashflowre.app · 2026-05-29