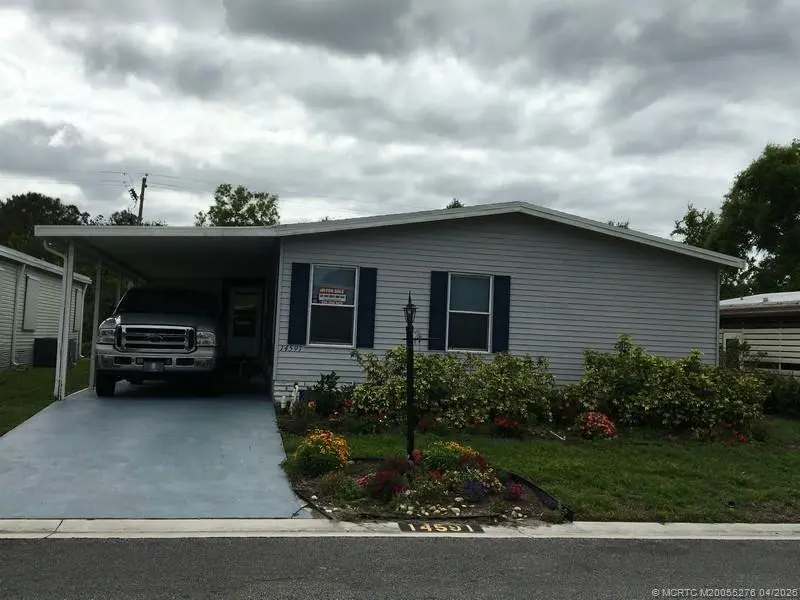
14591 SW Divot Dr Unit A-20
Indiantown, FL 34956
$45,900C-
2 bd · 2.0 ba ·
1,790 sqft ·
Built 1989
· Manufactured
· Active
· 65 DOM
Cashflow @ list (25.0% down · 7.5%)
Estimated rent
$2,336/mo
Mortgage (P&I)
−$241
Tax + insurance
−$76
HOA
−$0
Vac / Maint / Mgmt
−$491
Net cashflow
$1,528/mo
Annual
$18,339/yr
Cap rate
46.25%
Cash-on-cash
142.69%
DSCR
7.35
1% rule
5.09%
Cash to close
$12,852
Investor read
- This is a 2-bed/2.0-bath manufactured listed at $46k.
- At list price, monthly cash flow is $2k ($18k/yr) — positive.
- The deal already cash-flows at list — no discount required.
- Meets the 1% rule at list price ($2k rent vs $46k).
- It's been on market 65 days — a 6% lower offer ($43k) is reasonable based on typical stale-listing flexibility.
- Recommended offer: $43k (6.0% below list) — sets the bar for market timing.
- In year one you build about $3k of equity ($317 loan paydown + $3k appreciation (6.7% local appreciation)).
- Location reads 59/100 on livability (#829 in FL) — a working-class tenant base; expect higher turnover. Strengths: cost of living A+, housing A+; Watch: schools F, amenities F, commute F.
- Martin (suburban): math 52% / reading 53% proficiency, ranked #24 of 73 in FL (top 33%) — acceptable for families but not a draw, mixed tenant base, ~2y average lease.
- Market conditions: 135 active listings in the ZIP; 2 comparable units currently listed for rent nearby; 737 units permitted in Martin County in 2024 (167 in 5+ unit buildings).
- Martin County population projected at +19% by 2050 — long-run rental-demand tailwind backs the buy-and-hold thesis.
- At projected returns (6.7% appreciation + 3.0% rent growth), your $13k cash investment doubles in ~1 year — after that, you're playing with house money.
- By year 9, paydown + projected appreciation supports a ~$31k cash-out refi (75% LTV) — recoverable capital for the next deal without selling this one.
- Climate carrying-cost: severe wind risk, 99% chance of damaging wind over 30y; moderate wildfire risk; extreme-heat days projected 7→24/yr by 2055 (HVAC capex compounding) — expect insurance premiums to compound above CPI over the hold.
- Cap rate 46.2% vs local median 10.9% in Indiantown — top-decile yield for the area; either an underpriced asset or a hidden risk that comps aren't pricing in. Stress-test before assuming the spread holds.
Questions for listing agent
- It's been on market 65 days. Have you received any prior offers? Is the seller open to a 6% concession, seller financing, or rate buy-down credit?
- Why hasn't it sold? Are there any deal-killer items the seller is aware of (foundation, flood, title, zoning, code violations)?
- Is there a deadline driving the sale (1031 exchange, divorce, estate, relocation)? That informs how much negotiation room exists.
- Schools are F-rated, which usually means shorter tenancies and higher turnover. Who's the typical renter profile here, and what's been the actual vacancy rate?
- What's the average days-on-market for RENTAL listings here right now (not sales)? A rising rental-DOM trend means longer vacancies and softer asking-rent achievability than the comps imply.
- What's the recent tenant-quality profile in this submarket — average credit score on applications, eviction rate, late-payment / NSF rate, and stable-employment percentage? A property-management company in the area should have these aggregated.
- How much new for-sale + rental construction is in the pipeline within 1–3 miles? Heavy new supply typically softens prices + rents 12–24 months out; constrained supply supports both.
CashFlowRE · CFR-8JJ34RF59APFDC
· Data 2 days ago
cashflowre.app · 2026-05-29