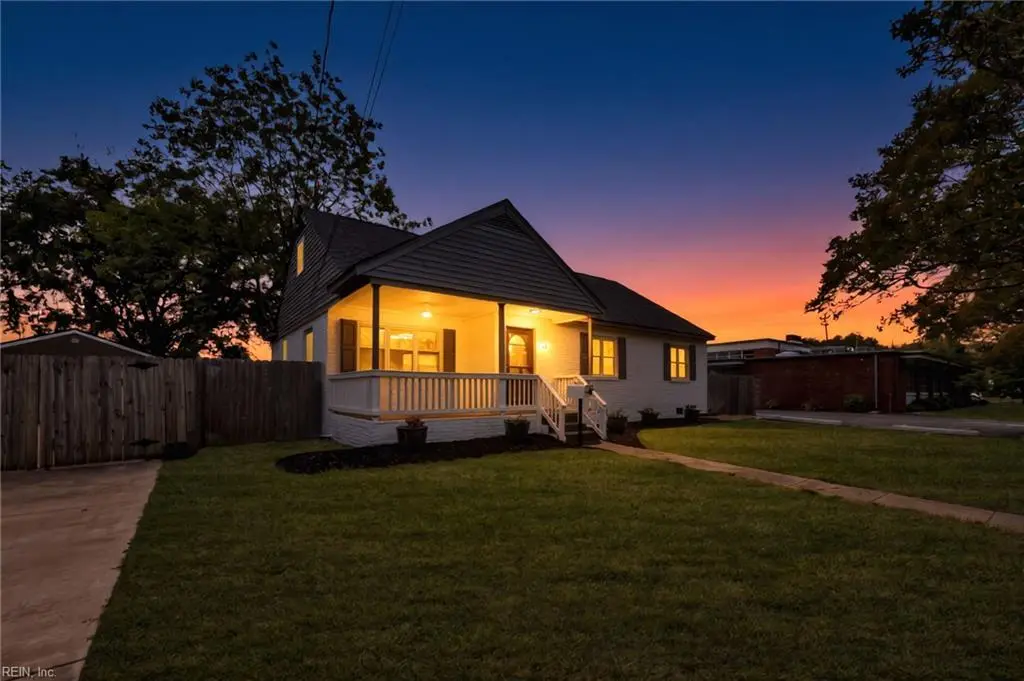
131 Forsythe St
Norfolk, VA 23505
$350,000D
3 bd · 1.0 ba ·
2,323 sqft ·
Built 1952
· SingleFamily
· Under Contract
· 20 DOM
Cashflow @ list (25.0% down · 7.5%)
Estimated rent
$2,481/mo
Mortgage (P&I)
−$1,835
Tax + insurance
−$441
HOA
−$0
Vac / Maint / Mgmt
−$521
Net cashflow
$-316/mo
Annual
$-3,797/yr
Cap rate
5.21%
Cash-on-cash
-3.87%
DSCR
0.83
1% rule
0.71%
Cash to close
$98,000
Investor read
- This is a 3-bed/1.0-bath single-family listed at $350k.
- At list price, monthly cash flow is $-316 ($-4k/yr) — negative.
- To cash-flow at today's rent, offer at most $294k (16.0% below list).
- To meet the 1% rule (rent ≥ 1% of price), the offer needs to be $248k (29.1% below list).
- It's been on market 20 days — a 2% lower offer ($345k) is reasonable based on typical stale-listing flexibility.
- Recommended offer: $248k (29.1% below list) — sets the bar for 1% rule.
- Local home prices are declining (-3.0%/yr); year-one equity from $2k of loan paydown is wiped out by about $10k of value loss. Plan a longer hold.
- Location reads 83/100 on livability (#43 in VA, #1,026 nationally) — a professional / high-income tenant draw. Strengths: amenities A+, commute A+, health & safety A+; Watch: employment C-, crime F.
- Norfolk City Public School District (urban): math 27% / reading 56% proficiency, ranked #118 of 131 in VA (top 90%) — families likely to look elsewhere, expect single-tenant / working-renter base with shorter leases.
- Zoned schools: Suburban Park Elementary (math 22% / reading 37%, grade F, #1,011 of 1,108 statewide, top 92%, 452 students, 98% FRL); Granby High (math 33% / reading 80%, grade C, #270 of 319 statewide, top 86%, 1,837 students, 94% FRL) — zoned schools average 96% FRL vs 59% district-wide (37 pts higher); higher-poverty schools than district average — tighter screening recommended.
- Watch-outs: built in 1952 — expect roof / HVAC / electrical / plumbing capex.
- Market conditions: Rents rising fast (+12.1%/yr); 108 active listings in the ZIP; 7 comparable units currently listed for rent nearby; rentals at typical pace (median 25d on market — plan ~3-4 weeks tenant-placement turnaround); 43% of comp listings sitting > 30 days — soft ceiling on asking rent; 438 units permitted in Norfolk city in 2024 (273 in 5+ unit buildings).
- 5 sale attempts with the ask held roughly flat each time — persistent listings suggest the price (not the market) is what's stuck; bring a comps-based counter.
- Current owner paid $260k; 35% above their basis — modest negotiation headroom, anchor on the comps not their cost.
- Climate carrying-cost: severe wind risk, 80% chance of damaging wind over 30y; extreme-heat days projected 7→16/yr by 2055 (HVAC capex compounding) — expect insurance premiums to compound above CPI over the hold.
- Cap rate 5.2% vs local median 4.0% in Norfolk — top-decile yield for the area; either an underpriced asset or a hidden risk that comps aren't pricing in. Stress-test before assuming the spread holds.
- At $2,481/mo this rent would consume 51% of the median local household income ($59k/yr) (locally 2299% of renters already pay >50% of income on rent) — very limited rent-growth headroom before tenants either downsize or default.
Questions for listing agent
- What do current leases actually rent for vs. the listed asking? Can we see a recent rent roll and the last 12 months of T-12 income?
- Built in 1952 — when were the roof, HVAC, electrical panel, plumbing, and water heater last replaced?
- Is there a deadline driving the sale (1031 exchange, divorce, estate, relocation)? That informs how much negotiation room exists.
- Schools are A-rated — typically a magnet for longer-tenancy family renters. What's the average tenant stay here, and is there a school-zone premium baked into asking?
- Crime grade is F in this area — have there been break-ins, vandalism, or insurance claims at this property in the last 3 years? What carrier currently insures it and at what premium?
- The area grade is low — what's the realistic commute time and amenity access for the typical tenant pool here? Any planned neighborhood developments (good or bad) we should know about?
- What's the average days-on-market for RENTAL listings here right now (not sales)? A rising rental-DOM trend means longer vacancies and softer asking-rent achievability than the comps imply.
- What's the recent tenant-quality profile in this submarket — average credit score on applications, eviction rate, late-payment / NSF rate, and stable-employment percentage? A property-management company in the area should have these aggregated.
CashFlowRE · CFR-8K7KRQA4DF3EDB
· Data 3 weeks ago
cashflowre.app · 2026-05-29