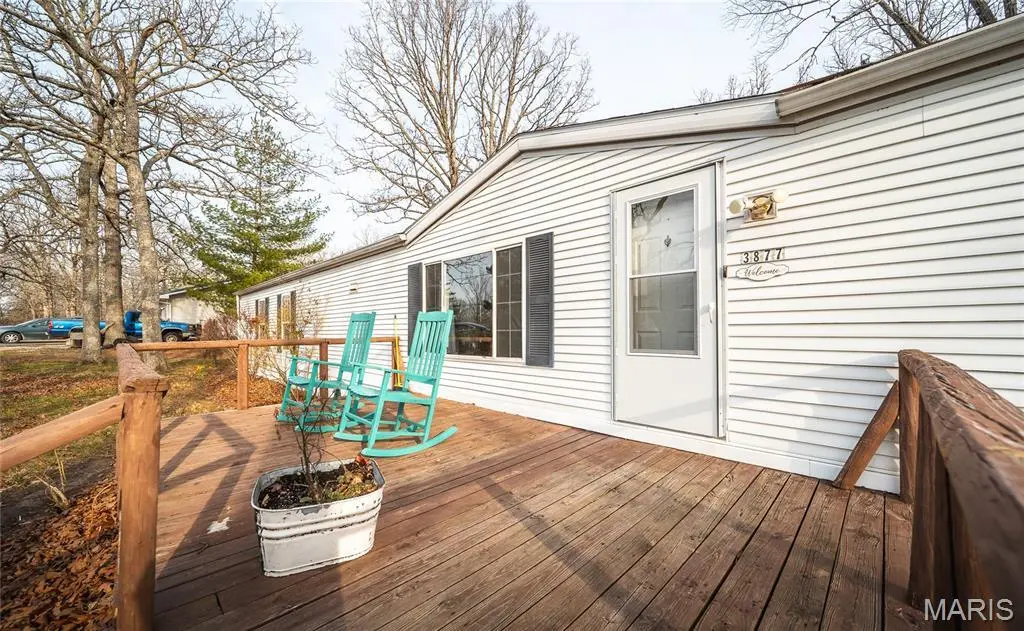
3877 E Highway 32
Salem, MO 65560
$117,500D+
3 bd · 2.0 ba ·
1,280 sqft ·
Built 1998
· SingleFamily
· Pending
· 43 DOM
Cashflow @ list (25.0% down · 7.5%)
Estimated rent
$890/mo
Mortgage (P&I)
−$616
Tax + insurance
−$196
HOA
−$0
Vac / Maint / Mgmt
−$187
Net cashflow
$-109/mo
Annual
$-1,303/yr
Cap rate
5.18%
Cash-on-cash
-3.96%
DSCR
0.82
1% rule
0.76%
Cash to close
$32,900
Investor read
- This is a 3-bed/2.0-bath single-family listed at $118k.
- At list price, monthly cash flow is $-109 ($-1k/yr) — negative.
- To cash-flow at today's rent, offer at most $102k (13.4% below list).
- To meet the 1% rule (rent ≥ 1% of price), the offer needs to be $89k (24.2% below list).
- It's been on market 43 days — a 3% lower offer ($114k) is reasonable based on typical stale-listing flexibility.
- Recommended offer: $89k (24.2% below list) — sets the bar for 1% rule.
- In year one you build about $7k of equity ($812 loan paydown + $7k appreciation (5.7% local appreciation)).
- Location reads 69/100 on livability (#157 in MO) — a middle-class / working-renter tenant base. Strengths: cost of living A+, health & safety A+, crime B; Watch: amenities C-, commute F, employment F.
- Salem R-80 (town): math 25% / reading 41% proficiency, ranked #253 of 324 in MO (top 78%) — families likely to look elsewhere, expect single-tenant / working-renter base with shorter leases.
- Zoned schools: Wm. H. Lynch Elem. (247 students, 50% FRL); Salem Sr. High (math 8% / reading 47%, grade F, #417 of 521 statewide, top 80%, 616 students, 46% FRL) — zoned schools at 48% FRL track the district average.
- Market conditions: 169 active listings in the ZIP; 3 units permitted in Dent County in 2024 (0 in 5+ unit buildings).
- Dent County population projected at -14% by 2050 — secular population decline; favor cash flow + early exit over multi-decade hold.
- 5 sale attempts since 4y ago with the ask held roughly flat each time — persistent listings suggest the price (not the market) is what's stuck; bring a comps-based counter.
- By year 5, paydown + projected appreciation supports a ~$33k cash-out refi (75% LTV) — recoverable capital for the next deal without selling this one.
- Climate carrying-cost: moderate wildfire risk — expect insurance premiums to compound above CPI over the hold.
- Cap rate 5.2% vs local median 2.7% in Salem — top-decile yield for the area; either an underpriced asset or a hidden risk that comps aren't pricing in. Stress-test before assuming the spread holds.
Questions for listing agent
- What do current leases actually rent for vs. the listed asking? Can we see a recent rent roll and the last 12 months of T-12 income?
- It's been on market 43 days. Have you received any prior offers? Is the seller open to a 24% concession, seller financing, or rate buy-down credit?
- Is there a deadline driving the sale (1031 exchange, divorce, estate, relocation)? That informs how much negotiation room exists.
- Schools are D-rated, which usually means shorter tenancies and higher turnover. Who's the typical renter profile here, and what's been the actual vacancy rate?
- The area grade is low — what's the realistic commute time and amenity access for the typical tenant pool here? Any planned neighborhood developments (good or bad) we should know about?
- What's the average days-on-market for RENTAL listings here right now (not sales)? A rising rental-DOM trend means longer vacancies and softer asking-rent achievability than the comps imply.
- What's the recent tenant-quality profile in this submarket — average credit score on applications, eviction rate, late-payment / NSF rate, and stable-employment percentage? A property-management company in the area should have these aggregated.
- How much new for-sale + rental construction is in the pipeline within 1–3 miles? Heavy new supply typically softens prices + rents 12–24 months out; constrained supply supports both.
CashFlowRE · CFR-8KAYF37FXDAYY5
· Data 1 week ago
cashflowre.app · 2026-05-29