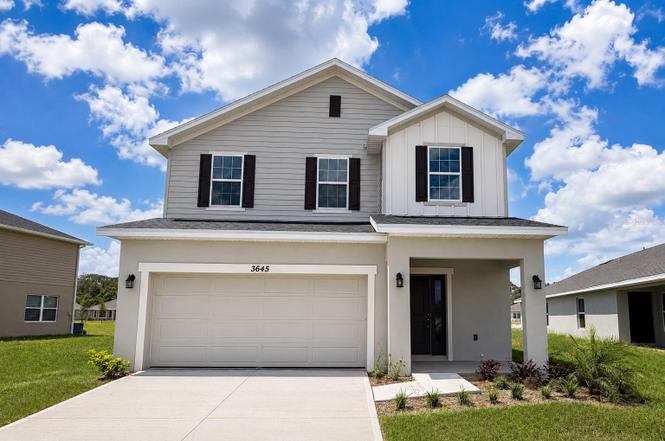
3645 Briarlynne Way
St. Cloud, FL 34773
$437,900F
4 bd · 2.5 ba ·
2,335 sqft ·
Built 2026
· Land
· Active
· 99 DOM
Cashflow @ list (25.0% down · 7.5%)
Estimated rent
$2,670/mo
Mortgage (P&I)
−$2,296
Tax + insurance
−$730
HOA
−$68
Vac / Maint / Mgmt
−$561
Net cashflow
$-985/mo
Annual
$-11,817/yr
Cap rate
3.59%
Cash-on-cash
-9.64%
DSCR
0.57
1% rule
0.61%
Cash to close
$122,612
Investor read
- This is a 4-bed/2.5-bath land listed at $438k.
- At list price, monthly cash flow is $-985 ($-12k/yr) — negative.
- To cash-flow at today's rent, offer at most $295k (32.5% below list).
- To meet the 1% rule (rent ≥ 1% of price), the offer needs to be $267k (39.0% below list).
- It's been on market 99 days — a 9% lower offer ($398k) is reasonable based on typical stale-listing flexibility.
- Recommended offer: $267k (39.0% below list) — sets the bar for 1% rule.
- In year one you build about $985 of equity ($3k loan paydown + $-2k appreciation (-0.5% local appreciation)).
- Location reads: area grade F — affects rentability + tenant quality, not the cash-flow math above.
- Osceola (suburban): math 39% / reading 45% proficiency, ranked #60 of 73 in FL (top 82%) — families likely to look elsewhere, expect single-tenant / working-renter base with shorter leases; 60% free/reduced lunch — lower-income household profile, screen leases tightly.
- Zoned schools: Harmony Community School (math 70% / reading 64%, grade B+, #450 of 2,144 statewide, top 22%, 1,012 students, 38% FRL); Harmony High School (math 40% / reading 46%, grade F, #255 of 667 statewide, top 39%, 2,822 students, 42% FRL) — zoned schools average 40% FRL vs 60% district-wide (20 pts lower); this property's tenant base skews higher-income than the district average.
- Zoned-school proficiency averages 55% at this address vs 42% district-wide (+13 pts) — the actual schools serving this property are materially stronger than the Osceola average implies; a family-tenant draw the district grade alone would hide.
- Market conditions: Rents rising (+1.8%/yr); 383 active listings in the ZIP; 11 comparable units currently listed for rent nearby; rentals at typical pace (median 24d on market — plan ~3-4 weeks tenant-placement turnaround); solid renter incomes; 8,813 units permitted in Osceola County in 2024 (3,072 in 5+ unit buildings).
- Osceola County population projected at +73% by 2050 — long-run rental-demand tailwind backs the buy-and-hold thesis.
- This rent runs 40% of the median local income ($81k/yr) — at the standard rent-burdened threshold; future hikes will face affordability resistance.
Questions for listing agent
- What do current leases actually rent for vs. the listed asking? Can we see a recent rent roll and the last 12 months of T-12 income?
- It's been on market 99 days. Have you received any prior offers? Is the seller open to a 39% concession, seller financing, or rate buy-down credit?
- What does the HOA fee cover, when was the last increase, and are there any pending special assessments or reserve-fund shortfalls?
- Why hasn't it sold? Are there any deal-killer items the seller is aware of (foundation, flood, title, zoning, code violations)?
- Is there a deadline driving the sale (1031 exchange, divorce, estate, relocation)? That informs how much negotiation room exists.
- The area grade is low — what's the realistic commute time and amenity access for the typical tenant pool here? Any planned neighborhood developments (good or bad) we should know about?
- What's the average days-on-market for RENTAL listings here right now (not sales)? A rising rental-DOM trend means longer vacancies and softer asking-rent achievability than the comps imply.
- What's the recent tenant-quality profile in this submarket — average credit score on applications, eviction rate, late-payment / NSF rate, and stable-employment percentage? A property-management company in the area should have these aggregated.
CashFlowRE · CFR-8KMN2J2RT1GDV7
· Data 2 days ago
cashflowre.app · 2026-05-29