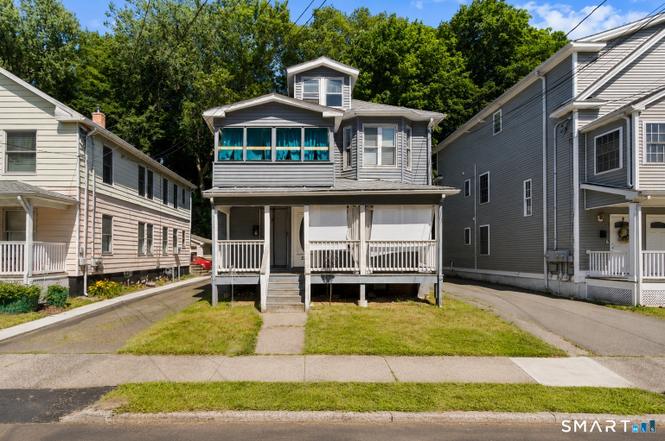
25 Prescott St
Meriden, CT 06450
$349,900C+
6 bd · 2.0 ba ·
1,992 sqft ·
Built 1922
· MultiFamily
· Active
· 1 DOM
Cashflow @ list (25.0% down · 7.5%)
Estimated rent
$3,607/mo
Mortgage (P&I)
−$1,835
Tax + insurance
−$556
HOA
−$0
Vac / Maint / Mgmt
−$757
Net cashflow
$458/mo
Annual
$5,500/yr
Cap rate
8.06%
Cash-on-cash
6.29%
DSCR
1.28
1% rule
1.03%
Cash to close
$97,972
Investor read
- This is a 2 × 2-bed/1.0-bath units multifamily listed at $350k.
- At list price, monthly cash flow is $458 ($6k/yr) — positive. Per door: $229/mo.
- The deal already cash-flows at list — no discount required.
- Meets the 1% rule at list price ($4k rent vs $350k).
- Only 1 days on market — expect competitive offers; lowballing is unlikely to land.
- Local home prices are declining (-3.0%/yr); year-one equity from $2k of loan paydown is wiped out by about $10k of value loss. Plan a longer hold.
- Location reads 85/100 on livability (#4 in CT, #505 nationally) — a professional / high-income tenant draw. Strengths: amenities A+, housing A+, health & safety A+.
- Meriden School District (suburban): math 27% / reading 41% proficiency, ranked #116 of 153 in CT (top 76%) — families likely to look elsewhere, expect single-tenant / working-renter base with shorter leases; 61% free/reduced lunch — lower-income household profile, screen leases tightly.
- Watch-outs: flood insurance adds $56/mo; built in 1922 — expect roof / HVAC / electrical / plumbing capex.
- Market conditions: Rents rising (+1.6%/yr); 98 active listings in the ZIP; 1 comparable units currently listed for rent nearby; 1,059 units permitted in South Central Connecticut Planning Region in 2024 (779 in 5+ unit buildings).
- 3 sale attempts since 10y ago; this cycle's ask is 89% above the opening price — seller raised mid-cycle; expect resistance to lowballs.
- Current owner paid $60k; list at $350k implies a 484% gain — meaningful room to come down on a strong offer.
- Climate carrying-cost: major flood risk; major wind risk, 27% chance of damaging wind over 30y; extreme-heat days projected 7→17/yr by 2055 (HVAC capex compounding) — expect insurance premiums to compound above CPI over the hold.
- Cap rate 8.1% vs local median 4.2% in Meriden — top-decile yield for the area; either an underpriced asset or a hidden risk that comps aren't pricing in. Stress-test before assuming the spread holds.
- At $3,607/mo this rent would consume 61% of the median local household income ($71k/yr) (locally 1516% of renters already pay >50% of income on rent) — very limited rent-growth headroom before tenants either downsize or default.
Questions for listing agent
- Can we see the unit-by-unit rent roll, current vacancy, and any below-market leases? What's the average tenancy length?
- What capital expenditures (roof, boiler, parking lot, exteriors) have been made in the last 5 years, and what's planned in the next 2?
- Built in 1922 — when were the roof, HVAC, electrical panel, plumbing, and water heater last replaced?
- What's the actual annual flood-insurance premium (NFIP or private), and is the property in a SFHA with mandatory coverage?
- Is there a deadline driving the sale (1031 exchange, divorce, estate, relocation)? That informs how much negotiation room exists.
- What's the average days-on-market for RENTAL listings here right now (not sales)? A rising rental-DOM trend means longer vacancies and softer asking-rent achievability than the comps imply.
- What's the recent tenant-quality profile in this submarket — average credit score on applications, eviction rate, late-payment / NSF rate, and stable-employment percentage? A property-management company in the area should have these aggregated.
- How much new apartment / multifamily construction is in the pipeline within 1–3 miles? Heavy new supply (>2% of stock underway) typically softens rents 12–24 months out; light construction supports rent growth.
CashFlowRE · CFR-8M60M18MRTAKYK
· Data 1 day ago
cashflowre.app · 2026-05-29