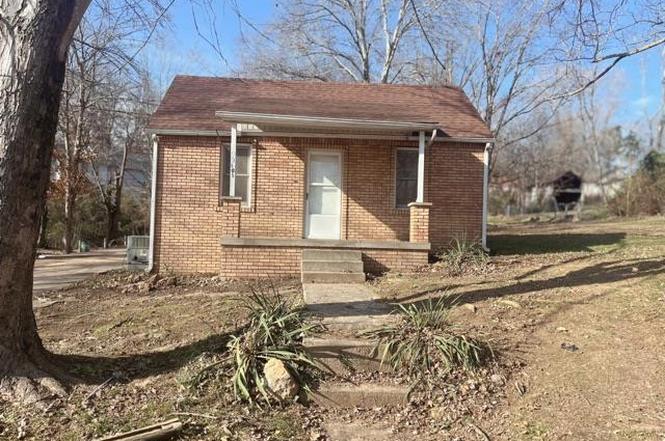
105 Broad St
Marble Hill, MO 63764
$69,900C-
1 bd · 1.0 ba ·
576 sqft ·
Built 1935
· SingleFamily
· Pending
· 148 DOM
Cashflow @ list (25.0% down · 7.5%)
Estimated rent
$774/mo
Mortgage (P&I)
−$367
Tax + insurance
−$116
HOA
−$0
Vac / Maint / Mgmt
−$163
Net cashflow
$128/mo
Annual
$1,540/yr
Cap rate
8.50%
Cash-on-cash
7.87%
DSCR
1.35
1% rule
1.11%
Cash to close
$19,572
Investor read
- This is a 1-bed/1.0-bath single-family listed at $70k. Condition is rated good.
- At list price, monthly cash flow is $128 ($2k/yr) — positive.
- The deal already cash-flows at list — no discount required.
- Meets the 1% rule at list price ($774 rent vs $70k).
- It's been on market 148 days — a 12% lower offer ($62k) is reasonable based on typical stale-listing flexibility.
- Recommended offer: $62k (12.0% below list) — sets the bar for market timing.
- In year one you build about $3k of equity ($483 loan paydown + $2k appreciation (3.0% local appreciation)).
- Location reads 60/100 on livability (#508 in MO) — a middle-class / working-renter tenant base. Strengths: cost of living A+, crime A, housing A-; Watch: amenities F, commute F, employment F.
- Woodland R-IV (rural): math 27% / reading 42% proficiency, ranked #239 of 324 in MO (top 74%) — families likely to look elsewhere, expect single-tenant / working-renter base with shorter leases.
- Zoned schools: Woodland Elem. (math 32% / reading 32%, grade F, #761 of 1,115 statewide, top 72%, 347 students, 63% FRL); Woodland High (math 12% / reading 37%, grade F, #445 of 521 statewide, top 87%, 248 students, 51% FRL) — zoned schools at 57% FRL track the district average.
- Watch-outs: built in 1935 — expect roof / HVAC / electrical / plumbing capex.
- Market conditions: 44 active listings in the ZIP.
- Bollinger County population projected at -14% by 2050 — secular population decline; favor cash flow + early exit over multi-decade hold.
- At projected returns (3.0% appreciation + 3.0% rent growth), your $20k cash investment doubles in ~5 years — after that, you're playing with house money.
- Climate carrying-cost: extreme-heat days projected 7→22/yr by 2055 (HVAC capex compounding) — expect insurance premiums to compound above CPI over the hold.
- Cap rate 8.5% vs local median 5.1% in Marble Hill — top-decile yield for the area; either an underpriced asset or a hidden risk that comps aren't pricing in. Stress-test before assuming the spread holds.
Questions for listing agent
- It's been on market 148 days. Have you received any prior offers? Is the seller open to a 12% concession, seller financing, or rate buy-down credit?
- Built in 1935 — when were the roof, HVAC, electrical panel, plumbing, and water heater last replaced?
- Why hasn't it sold? Are there any deal-killer items the seller is aware of (foundation, flood, title, zoning, code violations)?
- Is there a deadline driving the sale (1031 exchange, divorce, estate, relocation)? That informs how much negotiation room exists.
- Schools are F-rated, which usually means shorter tenancies and higher turnover. Who's the typical renter profile here, and what's been the actual vacancy rate?
- What's the average days-on-market for RENTAL listings here right now (not sales)? A rising rental-DOM trend means longer vacancies and softer asking-rent achievability than the comps imply.
- What's the recent tenant-quality profile in this submarket — average credit score on applications, eviction rate, late-payment / NSF rate, and stable-employment percentage? A property-management company in the area should have these aggregated.
- How much new for-sale + rental construction is in the pipeline within 1–3 miles? Heavy new supply typically softens prices + rents 12–24 months out; constrained supply supports both.
CashFlowRE · CFR-8MQ6TS8B87DX7Y
· Data 3 weeks ago
cashflowre.app · 2026-05-29