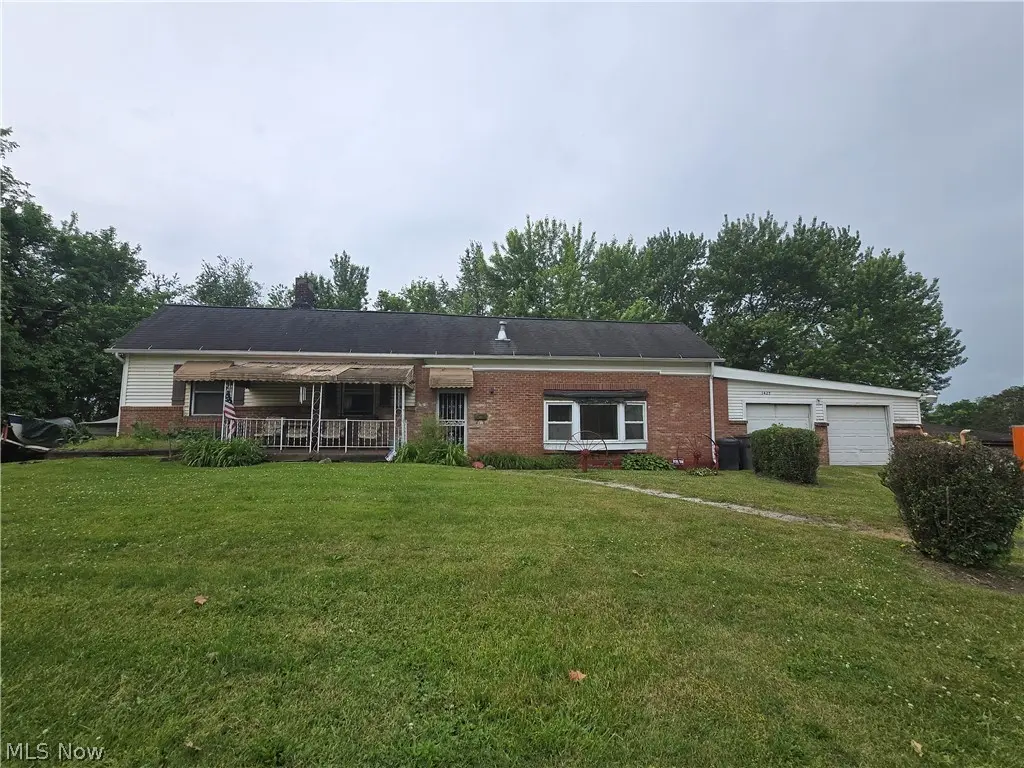
1427 Hawn St
Youngstown, OH 44506
$129,000D+
3 bd · 1.0 ba ·
1,552 sqft ·
Built 1920
· SingleFamily
· Active
· 12 DOM
Cashflow @ list (25.0% down · 7.5%)
Estimated rent
$1,279/mo
Mortgage (P&I)
−$676
Tax + insurance
−$215
HOA
−$0
Vac / Maint / Mgmt
−$269
Net cashflow
$119/mo
Annual
$1,431/yr
Cap rate
7.40%
Cash-on-cash
3.96%
DSCR
1.18
1% rule
0.99%
Cash to close
$36,120
Investor read
- This is a 3-bed/1.0-bath single-family listed at $129k.
- At list price, monthly cash flow is $119 ($1k/yr) — positive.
- The deal already cash-flows at list — no discount required.
- To meet the 1% rule (rent ≥ 1% of price), the offer needs to be $128k (0.8% below list).
- Only 12 days on market — expect competitive offers; lowballing is unlikely to land.
- Recommended offer: $128k (0.8% below list) — sets the bar for 1% rule.
- In year one you build about $8k of equity ($892 loan paydown + $7k appreciation (5.6% local appreciation)).
- Location reads 81/100 on livability (#99 in OH, #1,506 nationally) — a professional / high-income tenant draw. Strengths: amenities A+, commute A+, cost of living A+; Watch: crime F, employment F.
- Youngstown City (urban): math 8% / reading 17% proficiency, ranked #649 of 656 in OH (top 99%) — low school quality limits family demand, transient renter base, plan for 1-2y turnover; 88% free/reduced lunch — lower-income household profile, screen leases tightly.
- Watch-outs: built in 1920 — expect roof / HVAC / electrical / plumbing capex.
- Market conditions: 6 active listings in the ZIP; 2 comparable units currently listed for rent nearby; lower-income renter base — watch delinquency; 147 units permitted in Mahoning County in 2024 (0 in 5+ unit buildings).
- Mahoning County population projected at -14% by 2050 — secular population decline; favor cash flow + early exit over multi-decade hold.
- At projected returns (5.6% appreciation + 3.0% rent growth), your $36k cash investment doubles in ~4 years — after that, you're playing with house money.
- By year 5, paydown + projected appreciation supports a ~$36k cash-out refi (75% LTV) — recoverable capital for the next deal without selling this one.
- At $1,279/mo this rent would consume 69% of the median local household income ($22k/yr) (locally 35% of renters already pay >50% of income on rent) — very limited rent-growth headroom before tenants either downsize or default.
Questions for listing agent
- Built in 1920 — when were the roof, HVAC, electrical panel, plumbing, and water heater last replaced?
- Is there a deadline driving the sale (1031 exchange, divorce, estate, relocation)? That informs how much negotiation room exists.
- Crime grade is F in this area — have there been break-ins, vandalism, or insurance claims at this property in the last 3 years? What carrier currently insures it and at what premium?
- The area grade is low — what's the realistic commute time and amenity access for the typical tenant pool here? Any planned neighborhood developments (good or bad) we should know about?
- What's the average days-on-market for RENTAL listings here right now (not sales)? A rising rental-DOM trend means longer vacancies and softer asking-rent achievability than the comps imply.
- What's the recent tenant-quality profile in this submarket — average credit score on applications, eviction rate, late-payment / NSF rate, and stable-employment percentage? A property-management company in the area should have these aggregated.
- How much new for-sale + rental construction is in the pipeline within 1–3 miles? Heavy new supply typically softens prices + rents 12–24 months out; constrained supply supports both.
CashFlowRE · CFR-8MXPAA4CWFDGE9
· Data 1 day ago
cashflowre.app · 2026-05-29