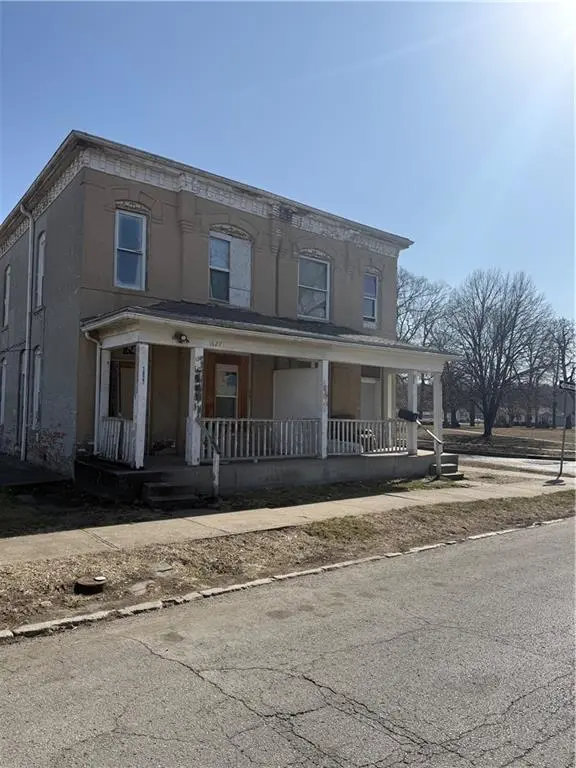
1627 S 10th St
St. Joseph, MO 64503
$109,900B-
4 bd · None ba ·
1,468 sqft ·
Built 1900
· MultiFamily
· Active
· 104 DOM
Cashflow @ list (25.0% down · 7.5%)
Estimated rent
$1,646/mo
Mortgage (P&I)
−$576
Tax + insurance
−$71
HOA
−$0
Vac / Maint / Mgmt
−$346
Net cashflow
$653/mo
Annual
$7,835/yr
Cap rate
13.42%
Cash-on-cash
25.46%
DSCR
2.13
1% rule
1.50%
Cash to close
$30,772
Investor read
- This is a 4-bed/?-bath multifamily listed at $110k.
- At list price, monthly cash flow is $653 ($8k/yr) — positive.
- The deal already cash-flows at list — no discount required.
- Meets the 1% rule at list price ($2k rent vs $110k).
- It's been on market 104 days — a 9% lower offer ($100k) is reasonable based on typical stale-listing flexibility.
- Recommended offer: $100k (9.0% below list) — sets the bar for market timing.
- Local home prices are declining (-3.0%/yr); year-one equity from $760 of loan paydown is wiped out by about $3k of value loss. Plan a longer hold.
- Location reads: area grade B — affects rentability + tenant quality, not the cash-flow math above.
- St. Joseph (urban): math 28% / reading 38% proficiency, ranked #241 of 324 in MO (top 74%) — families likely to look elsewhere, expect single-tenant / working-renter base with shorter leases.
- Zoned schools: Carden Park Elem (math 34% / reading 34%, grade F, #739 of 1,115 statewide, top 67%, 577 students, 100% FRL); Truman Middle (math 17% / reading 27%, grade F, #332 of 391 statewide, top 86%, 482 students, 99% FRL); Lafayette High (math 16% / reading 47%, grade F, #371 of 521 statewide, top 71%, 717 students, 100% FRL) — zoned schools average 100% FRL vs 53% district-wide (47 pts higher); higher-poverty schools than district average — tighter screening recommended.
- Watch-outs: built in 1900 — expect roof / HVAC / electrical / plumbing capex.
- Market conditions: 91 active listings in the ZIP; 2 comparable units currently listed for rent nearby; 70 units permitted in Buchanan County in 2024 (0 in 5+ unit buildings).
- Buchanan County population projected to shrink 6% by 2050 — rents likely to lag national; underwrite the cash flow, not the appreciation.
- At projected returns (-3.0% appreciation + 3.0% rent growth), your $31k cash investment doubles in ~5 years — after that, you're playing with house money.
- Cap rate 13.4% vs local median 4.7% in St. Joseph — top-decile yield for the area; either an underpriced asset or a hidden risk that comps aren't pricing in. Stress-test before assuming the spread holds.
Questions for listing agent
- It's been on market 104 days. Have you received any prior offers? Is the seller open to a 9% concession, seller financing, or rate buy-down credit?
- Built in 1900 — when were the roof, HVAC, electrical panel, plumbing, and water heater last replaced?
- Why hasn't it sold? Are there any deal-killer items the seller is aware of (foundation, flood, title, zoning, code violations)?
- Is there a deadline driving the sale (1031 exchange, divorce, estate, relocation)? That informs how much negotiation room exists.
- What's the average days-on-market for RENTAL listings here right now (not sales)? A rising rental-DOM trend means longer vacancies and softer asking-rent achievability than the comps imply.
- What's the recent tenant-quality profile in this submarket — average credit score on applications, eviction rate, late-payment / NSF rate, and stable-employment percentage? A property-management company in the area should have these aggregated.
- How much new apartment / multifamily construction is in the pipeline within 1–3 miles? Heavy new supply (>2% of stock underway) typically softens rents 12–24 months out; light construction supports rent growth.
CashFlowRE · CFR-8QHQ9K8W0H5ZEW
· Data 2 weeks ago
cashflowre.app · 2026-05-29