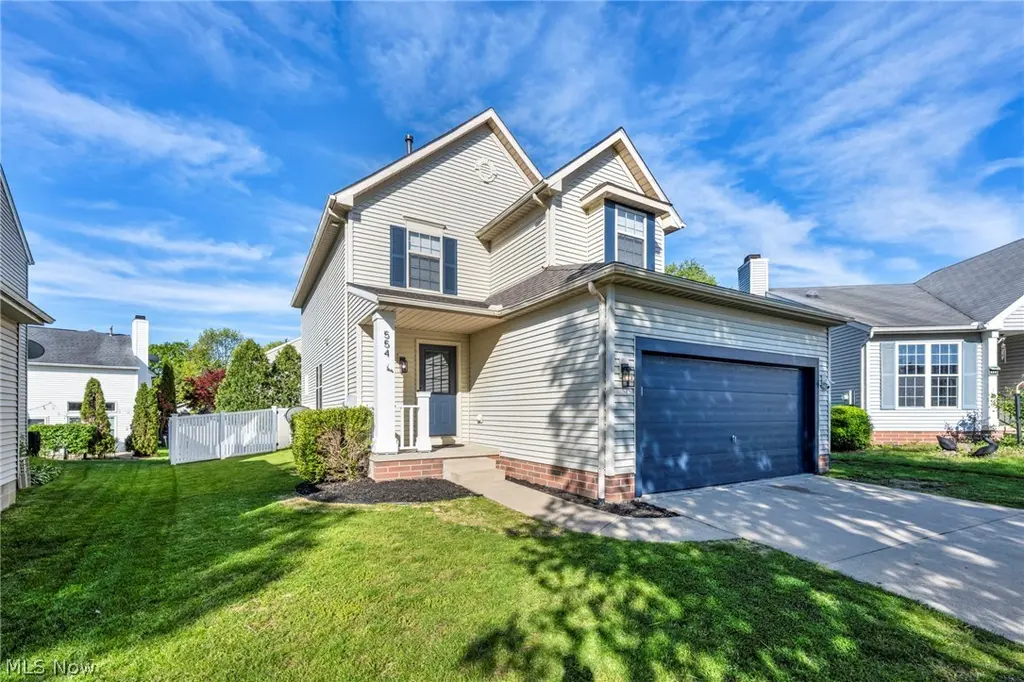
554 Hastings Ct
Akron, OH 44319
$299,900C+
3 bd · 2.5 ba ·
1,538 sqft ·
Built 1998
· SingleFamily
· Pending
· 30 DOM
Cashflow @ list (25.0% down · 7.5%)
Estimated rent
$4,108/mo
Mortgage (P&I)
−$1,573
Tax + insurance
−$469
HOA
−$21
Vac / Maint / Mgmt
−$863
Net cashflow
$1,183/mo
Annual
$14,191/yr
Cap rate
11.02%
Cash-on-cash
16.90%
DSCR
1.75
1% rule
1.37%
Cash to close
$83,972
Investor read
- This is a 3-bed/2.5-bath single-family listed at $300k.
- At list price, monthly cash flow is $1k ($14k/yr) — positive.
- The deal already cash-flows at list — no discount required.
- Meets the 1% rule at list price ($4k rent vs $300k).
- It's been on market 30 days — a 2% lower offer ($295k) is reasonable based on typical stale-listing flexibility.
- Recommended offer: $295k (1.5% below list) — sets the bar for market timing.
- Local home prices are declining (-3.0%/yr); year-one equity from $2k of loan paydown is wiped out by about $9k of value loss. Plan a longer hold.
- Location reads 81/100 on livability (#104 in OH, #1,591 nationally) — a professional / high-income tenant draw. Strengths: amenities A+, commute A+, cost of living A+; Watch: crime F, employment F.
- Coventry Local (suburban): math 52% / reading 64% proficiency, ranked #315 of 656 in OH (top 48%) — acceptable for families but not a draw, mixed tenant base, ~2y average lease.
- Market conditions: 90 active listings in the ZIP; 2 comparable units currently listed for rent nearby; 1,114 units permitted in Summit County in 2024 (397 in 5+ unit buildings).
- Summit County population projected to shrink 6% by 2050 — rents likely to lag national; underwrite the cash flow, not the appreciation.
- 6 sale attempts since 27y ago with the ask held roughly flat each time — persistent listings suggest the price (not the market) is what's stuck; bring a comps-based counter.
- Current owner paid $224k; 34% above their basis — modest negotiation headroom, anchor on the comps not their cost.
- At projected returns (-3.0% appreciation + 3.0% rent growth), your $84k cash investment doubles in ~8 years — after that, you're playing with house money.
- Cap rate 11.0% vs local median 6.6% in Akron — top-decile yield for the area; either an underpriced asset or a hidden risk that comps aren't pricing in. Stress-test before assuming the spread holds.
- At $4,108/mo this rent would consume 66% of the median local household income ($75k/yr) — very limited rent-growth headroom before tenants either downsize or default.
Questions for listing agent
- What does the HOA fee cover, when was the last increase, and are there any pending special assessments or reserve-fund shortfalls?
- Is there a deadline driving the sale (1031 exchange, divorce, estate, relocation)? That informs how much negotiation room exists.
- Crime grade is F in this area — have there been break-ins, vandalism, or insurance claims at this property in the last 3 years? What carrier currently insures it and at what premium?
- What's the average days-on-market for RENTAL listings here right now (not sales)? A rising rental-DOM trend means longer vacancies and softer asking-rent achievability than the comps imply.
- What's the recent tenant-quality profile in this submarket — average credit score on applications, eviction rate, late-payment / NSF rate, and stable-employment percentage? A property-management company in the area should have these aggregated.
- How much new for-sale + rental construction is in the pipeline within 1–3 miles? Heavy new supply typically softens prices + rents 12–24 months out; constrained supply supports both.
CashFlowRE · CFR-8RGVRYBA8DVGTF
· Data 5 days ago
cashflowre.app · 2026-05-29