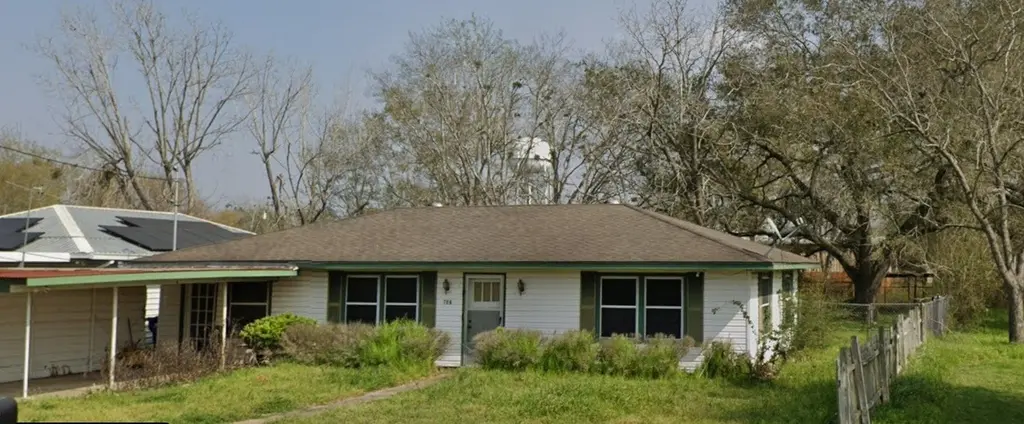
706 Cemetery Ave
Eagle Lake, TX 77434
$120,000D
3 bd · 1.0 ba ·
1,292 sqft ·
Built 1950
· SingleFamily
· Active
· 4 DOM
Cashflow @ list (25.0% down · 7.5%)
Estimated rent
$975/mo
Mortgage (P&I)
−$629
Tax + insurance
−$279
HOA
−$0
Vac / Maint / Mgmt
−$205
Net cashflow
$-138/mo
Annual
$-1,661/yr
Cap rate
4.91%
Cash-on-cash
-4.94%
DSCR
0.78
1% rule
0.81%
Cash to close
$33,600
Investor read
- This is a 3-bed/1.0-bath single-family listed at $120k.
- At list price, monthly cash flow is $-138 ($-2k/yr) — negative.
- To cash-flow at today's rent, offer at most $96k (20.4% below list).
- To meet the 1% rule (rent ≥ 1% of price), the offer needs to be $98k (18.8% below list).
- Only 4 days on market — expect competitive offers; lowballing is unlikely to land.
- Recommended offer: $96k (20.4% below list) — sets the bar for cash-flow.
- In year one you build about $2k of equity ($830 loan paydown + $2k appreciation (1.3% local appreciation)).
- Location reads 62/100 on livability (#913 in TX) — a middle-class / working-renter tenant base. Strengths: cost of living A+, crime A-, housing B+; Watch: amenities F, commute F, employment D-.
- Rice CISD (rural): math 34% / reading 32% proficiency, ranked #574 of 826 in TX (top 70%) — families likely to look elsewhere, expect single-tenant / working-renter base with shorter leases; 68% free/reduced lunch — lower-income household profile, screen leases tightly.
- Zoned schools: Eagle Lake Int (math 37% / reading 27%, grade F, #2,268 of 4,322 statewide, top 55%, 180 students, 87% FRL); Rice Jh (math 31% / reading 30%, grade F, #1,036 of 1,662 statewide, top 63%, 256 students, 80% FRL) — zoned schools average 83% FRL vs 68% district-wide (16 pts higher); higher-poverty schools than district average — tighter screening recommended.
- Watch-outs: built in 1950 — expect roof / HVAC / electrical / plumbing capex.
- Market conditions: 60 active listings in the ZIP; 1 comparable units currently listed for rent nearby; 29 units permitted in Colorado County in 2024 (0 in 5+ unit buildings).
- 2 sale attempts since 4y ago with the ask held roughly flat each time — persistent listings suggest the price (not the market) is what's stuck; bring a comps-based counter.
- Cap rate 4.9% vs local median 3.7% in Eagle Lake — top-decile yield for the area; either an underpriced asset or a hidden risk that comps aren't pricing in. Stress-test before assuming the spread holds.
Questions for listing agent
- What do current leases actually rent for vs. the listed asking? Can we see a recent rent roll and the last 12 months of T-12 income?
- Built in 1950 — when were the roof, HVAC, electrical panel, plumbing, and water heater last replaced?
- Is there a deadline driving the sale (1031 exchange, divorce, estate, relocation)? That informs how much negotiation room exists.
- Schools are F-rated, which usually means shorter tenancies and higher turnover. Who's the typical renter profile here, and what's been the actual vacancy rate?
- The area grade is low — what's the realistic commute time and amenity access for the typical tenant pool here? Any planned neighborhood developments (good or bad) we should know about?
- What's the average days-on-market for RENTAL listings here right now (not sales)? A rising rental-DOM trend means longer vacancies and softer asking-rent achievability than the comps imply.
- What's the recent tenant-quality profile in this submarket — average credit score on applications, eviction rate, late-payment / NSF rate, and stable-employment percentage? A property-management company in the area should have these aggregated.
- How much new for-sale + rental construction is in the pipeline within 1–3 miles? Heavy new supply typically softens prices + rents 12–24 months out; constrained supply supports both.
CashFlowRE · CFR-8TBBZ8DV8Q5GM3
· Data 3 h ago
cashflowre.app · 2026-05-29