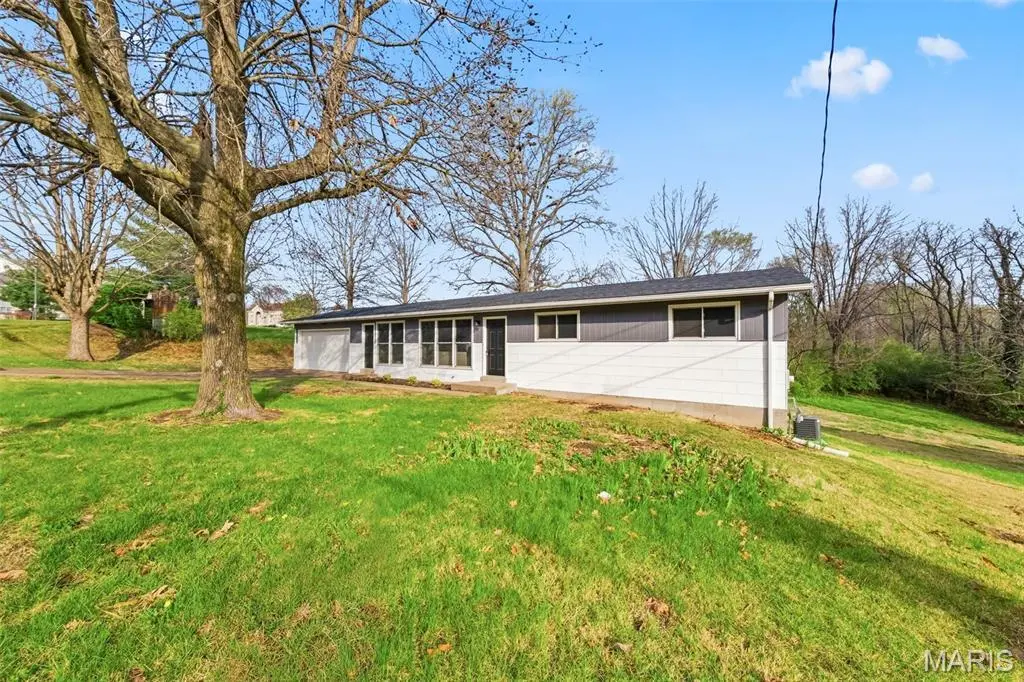
13035 Old Jamestown Rd
Black Jack, MO 63033
$264,900D
3 bd · 1.5 ba ·
1,352 sqft ·
Built 1959
· SingleFamily
· Pending
· 37 DOM
Cashflow @ list (25.0% down · 7.5%)
Estimated rent
$2,023/mo
Mortgage (P&I)
−$1,389
Tax + insurance
−$311
HOA
−$0
Vac / Maint / Mgmt
−$425
Net cashflow
$-102/mo
Annual
$-1,219/yr
Cap rate
5.83%
Cash-on-cash
-1.64%
DSCR
0.93
1% rule
0.76%
Cash to close
$74,172
Investor read
- This is a 3-bed/1.5-bath single-family listed at $265k.
- At list price, monthly cash flow is $-102 ($-1k/yr) — negative.
- To cash-flow at today's rent, offer at most $247k (6.8% below list).
- To meet the 1% rule (rent ≥ 1% of price), the offer needs to be $202k (23.6% below list).
- It's been on market 37 days — a 3% lower offer ($257k) is reasonable based on typical stale-listing flexibility.
- Recommended offer: $202k (23.6% below list) — sets the bar for 1% rule.
- In year one you build about $28k of equity ($2k loan paydown + $26k appreciation (10.0% local appreciation)).
- Location reads 70/100 on livability (#132 in MO) — a middle-class / working-renter tenant base. Strengths: cost of living A+, housing A+; Watch: health & safety C-, crime D+, amenities F.
- Hazelwood (suburban): math 11% / reading 26% proficiency, ranked #306 of 324 in MO (top 94%) — low school quality limits family demand, transient renter base, plan for 1-2y turnover.
- Zoned schools: Jamestown Elem. (math 2% / reading 37%, grade F, #935 of 1,115 statewide, top 84%, 333 students, 66% FRL); Central Middle (math 12% / reading 25%, grade F, #348 of 391 statewide, top 89%, 707 students, 68% FRL); Hazelwood Central High (math 12% / reading 33%, grade F, #455 of 521 statewide, top 88%, 1,628 students, 52% FRL).
- Watch-outs: built in 1959 — expect roof / HVAC / electrical / plumbing capex.
- Market conditions: Rents rising fast (+7.5%/yr); 221 active listings in the ZIP; 8 comparable units currently listed for rent nearby; rentals at typical pace (median 19d on market — plan ~3-4 weeks tenant-placement turnaround); 920 units permitted in St. Louis County in 2024 (250 in 5+ unit buildings).
- 2 sale attempts with the ask held roughly flat each time — persistent listings suggest the price (not the market) is what's stuck; bring a comps-based counter.
- By year 2, paydown + projected appreciation supports a ~$46k cash-out refi (75% LTV) — recoverable capital for the next deal without selling this one.
- Climate carrying-cost: extreme-heat days projected 7→21/yr by 2055 (HVAC capex compounding) — expect insurance premiums to compound above CPI over the hold.
- This rent runs 36% of the median local income ($67k/yr) — at the standard rent-burdened threshold; future hikes will face affordability resistance.
Questions for listing agent
- What do current leases actually rent for vs. the listed asking? Can we see a recent rent roll and the last 12 months of T-12 income?
- It's been on market 37 days. Have you received any prior offers? Is the seller open to a 24% concession, seller financing, or rate buy-down credit?
- Built in 1959 — when were the roof, HVAC, electrical panel, plumbing, and water heater last replaced?
- Is there a deadline driving the sale (1031 exchange, divorce, estate, relocation)? That informs how much negotiation room exists.
- Crime grade is D in this area — have there been break-ins, vandalism, or insurance claims at this property in the last 3 years? What carrier currently insures it and at what premium?
- The area grade is low — what's the realistic commute time and amenity access for the typical tenant pool here? Any planned neighborhood developments (good or bad) we should know about?
- What's the average days-on-market for RENTAL listings here right now (not sales)? A rising rental-DOM trend means longer vacancies and softer asking-rent achievability than the comps imply.
- What's the recent tenant-quality profile in this submarket — average credit score on applications, eviction rate, late-payment / NSF rate, and stable-employment percentage? A property-management company in the area should have these aggregated.
CashFlowRE · CFR-8TMJ5ZA0Z2812M
· Data 4 weeks ago
cashflowre.app · 2026-05-29