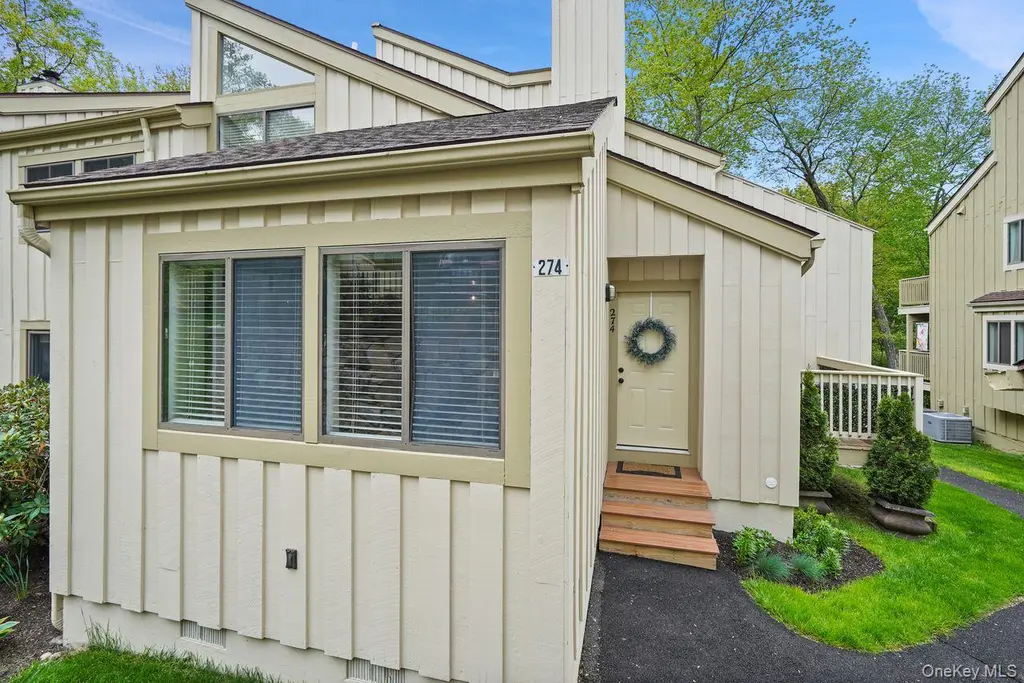
274 Maplewood Dr
Scotts Corners, NY 10590
$399,000D-
1 bd · 1.0 ba ·
970 sqft ·
Built 1994
· SingleFamily
· Pending
· 13 DOM
Cashflow @ list (25.0% down · 7.5%)
Estimated rent
$3,624/mo
Mortgage (P&I)
−$2,092
Tax + insurance
−$567
HOA
−$458
Vac / Maint / Mgmt
−$761
Net cashflow
$-255/mo
Annual
$-3,064/yr
Cap rate
5.53%
Cash-on-cash
-2.74%
DSCR
0.88
1% rule
0.91%
Cash to close
$111,720
Investor read
- This is a 1-bed/1.0-bath single-family listed at $399k.
- At list price, monthly cash flow is $-255 ($-3k/yr) — negative.
- To cash-flow at today's rent, offer at most $354k (11.3% below list).
- To meet the 1% rule (rent ≥ 1% of price), the offer needs to be $362k (9.2% below list).
- Only 13 days on market — expect competitive offers; lowballing is unlikely to land.
- Recommended offer: $354k (11.3% below list) — sets the bar for cash-flow.
- Local home prices are declining (-3.0%/yr); year-one equity from $3k of loan paydown is wiped out by about $12k of value loss. Plan a longer hold.
- Location reads 63/100 on livability (#810 in NY) — a middle-class / working-renter tenant base. Strengths: crime A+, employment A+, housing B+; Watch: amenities F, commute F, cost of living F.
- Katonah-Lewisboro Union Free School District (suburban): math 75% / reading 82% proficiency, ranked #32 of 590 in NY (top 5%) — strong family-tenant draw, lease renewals of 3-5y typical; only 3% free/reduced lunch — higher-income household profile.
- Zoned schools: Meadow Pond Elementary School (math 77% / reading 87%, grade A+, #138 of 2,108 statewide, top 8%, 342 students, 8% FRL); John Jay Middle School (math 58% / reading 79%, grade A, #94 of 729 statewide, top 13%, 662 students, 7% FRL); John Jay High School (math 98% / reading 82%, grade A+, #238 of 1,100 statewide, top 23%, 917 students, 9% FRL) — zoned schools at 8% FRL track the district average.
- Market conditions: 54 active listings in the ZIP; 954 units permitted in Westchester County in 2024 (649 in 5+ unit buildings).
- Westchester County population projected at +10% by 2050 — modest demand growth; plan on rents tracking national, not racing it.
- 4 sale attempts since 7y ago; this cycle's ask is 4% above the opening price — seller raised mid-cycle; expect resistance to lowballs.
- Climate carrying-cost: major wind risk, 27% chance of damaging wind over 30y — expect insurance premiums to compound above CPI over the hold.
- Cap rate 5.5% vs local median 2.6% in Scotts Corners — top-decile yield for the area; either an underpriced asset or a hidden risk that comps aren't pricing in. Stress-test before assuming the spread holds.
Questions for listing agent
- What do current leases actually rent for vs. the listed asking? Can we see a recent rent roll and the last 12 months of T-12 income?
- What does the HOA fee cover, when was the last increase, and are there any pending special assessments or reserve-fund shortfalls?
- Is there a deadline driving the sale (1031 exchange, divorce, estate, relocation)? That informs how much negotiation room exists.
- The area grade is low — what's the realistic commute time and amenity access for the typical tenant pool here? Any planned neighborhood developments (good or bad) we should know about?
- What's the average days-on-market for RENTAL listings here right now (not sales)? A rising rental-DOM trend means longer vacancies and softer asking-rent achievability than the comps imply.
- What's the recent tenant-quality profile in this submarket — average credit score on applications, eviction rate, late-payment / NSF rate, and stable-employment percentage? A property-management company in the area should have these aggregated.
- How much new for-sale + rental construction is in the pipeline within 1–3 miles? Heavy new supply typically softens prices + rents 12–24 months out; constrained supply supports both.
CashFlowRE · CFR-8XPSAV1MGKCWY3
· Data 1 week ago
cashflowre.app · 2026-05-29