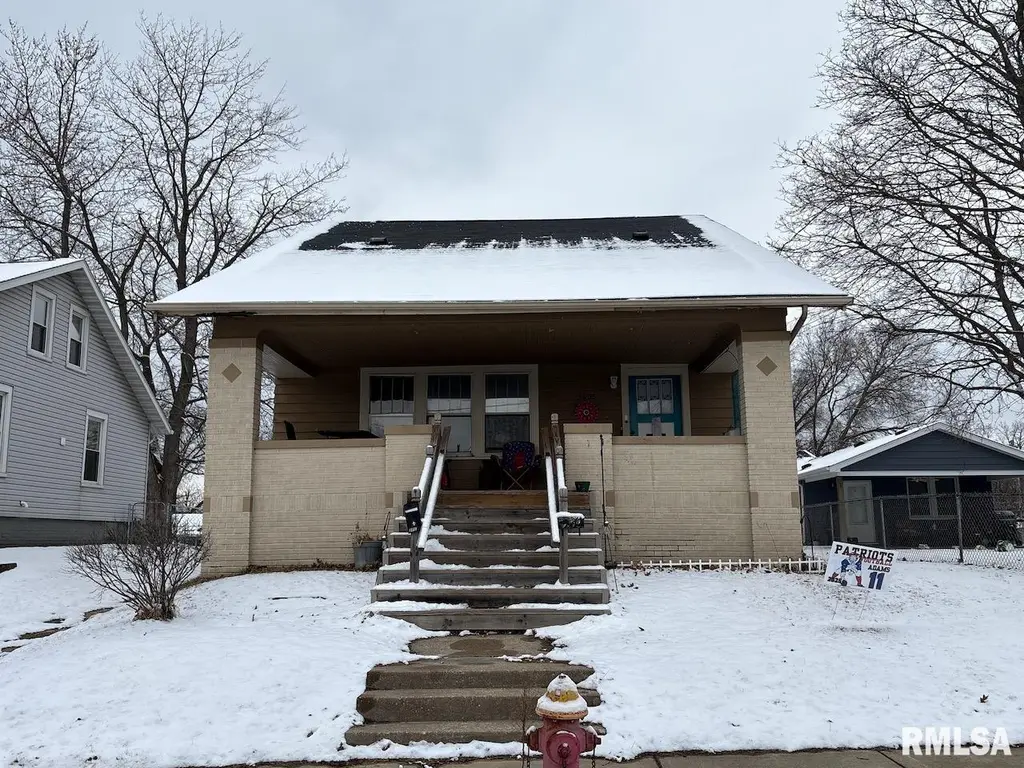
3905 N Vincent Ave
Peoria Heights, IL 61616
$175,000C+
5 bd · 2.0 ba ·
1,640 sqft ·
Built 1930
· MultiFamily
· Active
· 113 DOM
Cashflow @ list (25.0% down · 7.5%)
Estimated rent
$2,596/mo
Mortgage (P&I)
−$918
Tax + insurance
−$380
HOA
−$0
Vac / Maint / Mgmt
−$545
Net cashflow
$753/mo
Annual
$9,037/yr
Cap rate
11.46%
Cash-on-cash
18.44%
DSCR
1.82
1% rule
1.48%
Cash to close
$49,000
Investor read
- This is a 2 × 2-bed/1.0-bath units multifamily listed at $175k.
- At list price, monthly cash flow is $753 ($9k/yr) — positive. Per door: $377/mo.
- The deal already cash-flows at list — no discount required.
- Meets the 1% rule at list price ($3k rent vs $175k).
- It's been on market 113 days — a 9% lower offer ($159k) is reasonable based on typical stale-listing flexibility.
- Recommended offer: $159k (9.0% below list) — sets the bar for market timing.
- Local home prices are declining (-3.0%/yr); year-one equity from $1k of loan paydown is wiped out by about $5k of value loss. Plan a longer hold.
- Location reads 62/100 on livability (#886 in IL) — a middle-class / working-renter tenant base. Strengths: cost of living A+, housing A-, health & safety B+; Watch: schools F, crime F, amenities F.
- Peoria Heights CUSD 325 (suburban): math 8% / reading 15% proficiency, ranked #560 of 620 in IL (top 90%) — low school quality limits family demand, transient renter base, plan for 1-2y turnover.
- Watch-outs: built in 1930 — expect roof / HVAC / electrical / plumbing capex.
- Market conditions: 32 active listings in the ZIP; 73 units permitted in Peoria County in 2024 (0 in 5+ unit buildings).
- Peoria County population projected at -11% by 2050 — secular population decline; favor cash flow + early exit over multi-decade hold.
- 3 sale attempts since 7y ago with the ask held roughly flat each time — persistent listings suggest the price (not the market) is what's stuck; bring a comps-based counter.
- Current owner paid $125k; 40% above their basis — modest negotiation headroom, anchor on the comps not their cost.
- At projected returns (-3.0% appreciation + 3.0% rent growth), your $49k cash investment doubles in ~7 years — after that, you're playing with house money.
- Cap rate 11.5% vs local median 8.8% in Peoria Heights — meaningfully above typical; check what's discounted (condition, days-on-market, listing class) to confirm the premium yield is real.
- At $2,596/mo this rent would consume 52% of the median local household income ($60k/yr) (locally 82% of renters already pay >50% of income on rent) — very limited rent-growth headroom before tenants either downsize or default.
Questions for listing agent
- It's been on market 113 days. Have you received any prior offers? Is the seller open to a 9% concession, seller financing, or rate buy-down credit?
- Can we see the unit-by-unit rent roll, current vacancy, and any below-market leases? What's the average tenancy length?
- What capital expenditures (roof, boiler, parking lot, exteriors) have been made in the last 5 years, and what's planned in the next 2?
- Built in 1930 — when were the roof, HVAC, electrical panel, plumbing, and water heater last replaced?
- Why hasn't it sold? Are there any deal-killer items the seller is aware of (foundation, flood, title, zoning, code violations)?
- Is there a deadline driving the sale (1031 exchange, divorce, estate, relocation)? That informs how much negotiation room exists.
- Schools are F-rated, which usually means shorter tenancies and higher turnover. Who's the typical renter profile here, and what's been the actual vacancy rate?
- Crime grade is F in this area — have there been break-ins, vandalism, or insurance claims at this property in the last 3 years? What carrier currently insures it and at what premium?
CashFlowRE · CFR-91SSXJC0ZXA9RS
· Data 1 day ago
cashflowre.app · 2026-05-29