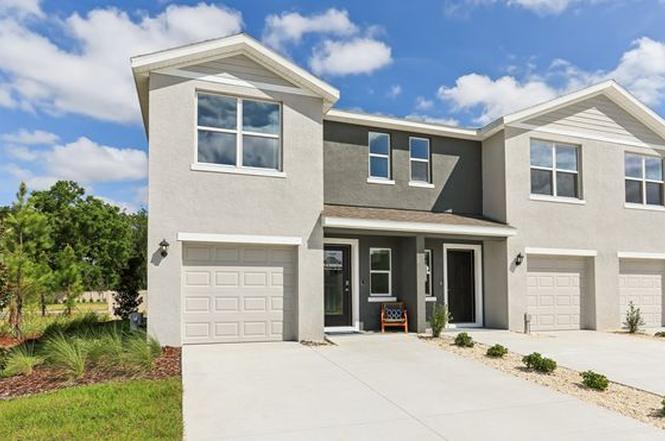
Pearson - Interior Unit Plan
Wildwood, FL 34785
$227,990F
3 bd · 2.5 ba ·
1,464 sqft ·
Built —
· SingleFamily
· Active
· 519 DOM
Cashflow @ list (25.0% down · 7.5%)
Estimated rent
$1,938/mo
Mortgage (P&I)
−$1,413
Tax + insurance
−$449
HOA
−$0
Vac / Maint / Mgmt
−$407
Net cashflow
$-331/mo
Annual
$-3,967/yr
Cap rate
4.82%
Cash-on-cash
-5.26%
DSCR
0.77
1% rule
0.72%
Cash to close
$75,425
Investor read
- This is a 3-bed/2.5-bath single-family listed at $228k.
- At list price, monthly cash flow is $-331 ($-4k/yr) — negative.
- To cash-flow at today's rent, offer at most $222k (2.8% below list).
- To meet the 1% rule (rent ≥ 1% of price), the offer needs to be $194k (15.0% below list).
- It's been on market 519 days — a 12% lower offer ($201k) is reasonable based on typical stale-listing flexibility.
- Recommended offer: $194k (15.0% below list) — sets the bar for 1% rule.
- Local home prices are declining (-3.0%/yr); year-one equity from $2k of loan paydown is wiped out by about $8k of value loss. Plan a longer hold.
- Location reads 69/100 on livability (#471 in FL) — a middle-class / working-renter tenant base. Strengths: health & safety A+, cost of living A, crime A-; Watch: schools C-, amenities F, commute F.
- Sumter (rural): math 61% / reading 61% proficiency, ranked #11 of 73 in FL (top 15%) — acceptable for families but not a draw, mixed tenant base, ~2y average lease.
- Market conditions: Rents rising (+2.9%/yr); 422 active listings in the ZIP; 7 comparable units currently listed for rent nearby; rentals at typical pace (median 21d on market — plan ~3-4 weeks tenant-placement turnaround); 3,961 units permitted in Sumter County in 2024 (248 in 5+ unit buildings).
- Sumter County population projected at +45% by 2050 — long-run rental-demand tailwind backs the buy-and-hold thesis.
- Cap rate 4.8% vs local median 3.9% in Wildwood — meaningfully above typical; check what's discounted (condition, days-on-market, listing class) to confirm the premium yield is real.
- This rent runs 35% of the median local income ($66k/yr) — at the standard rent-burdened threshold; future hikes will face affordability resistance.
Questions for listing agent
- What do current leases actually rent for vs. the listed asking? Can we see a recent rent roll and the last 12 months of T-12 income?
- It's been on market 519 days. Have you received any prior offers? Is the seller open to a 15% concession, seller financing, or rate buy-down credit?
- Why hasn't it sold? Are there any deal-killer items the seller is aware of (foundation, flood, title, zoning, code violations)?
- Is there a deadline driving the sale (1031 exchange, divorce, estate, relocation)? That informs how much negotiation room exists.
- The area grade is low — what's the realistic commute time and amenity access for the typical tenant pool here? Any planned neighborhood developments (good or bad) we should know about?
- What's the average days-on-market for RENTAL listings here right now (not sales)? A rising rental-DOM trend means longer vacancies and softer asking-rent achievability than the comps imply.
- What's the recent tenant-quality profile in this submarket — average credit score on applications, eviction rate, late-payment / NSF rate, and stable-employment percentage? A property-management company in the area should have these aggregated.
- How much new for-sale + rental construction is in the pipeline within 1–3 miles? Heavy new supply typically softens prices + rents 12–24 months out; constrained supply supports both.
CashFlowRE · CFR-938CC0F35SEVTM
· Data 1 day ago
cashflowre.app · 2026-05-29