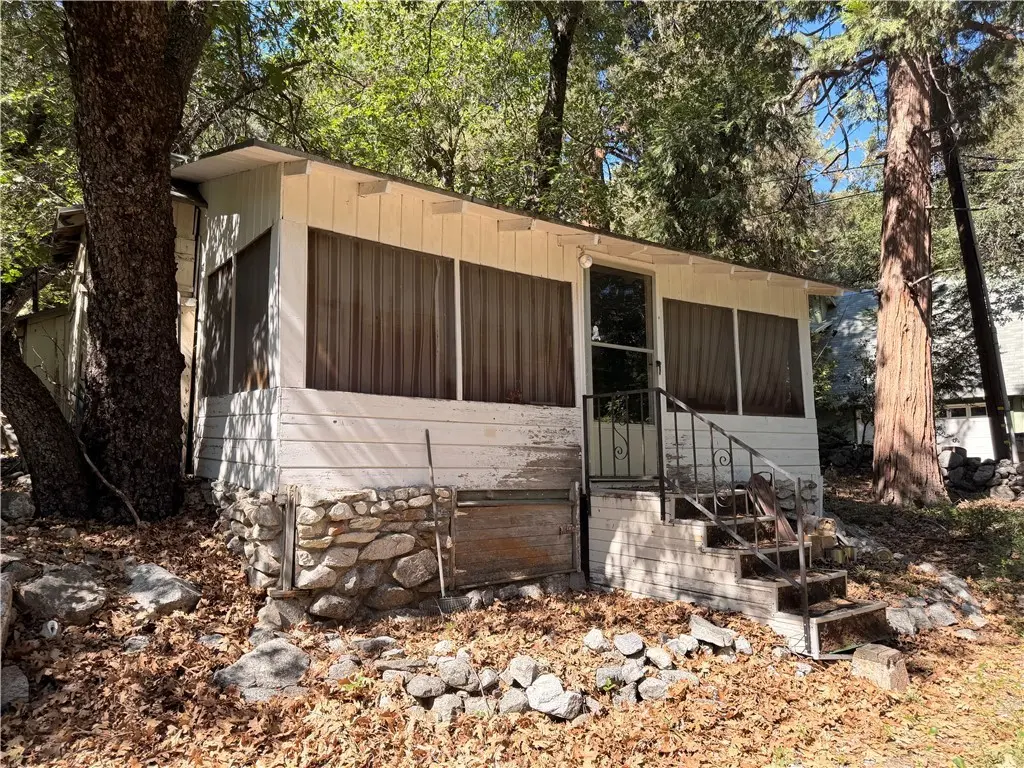
9200 May
Oak Glen, CA 92339
$100,000B+
1 bd · 1.0 ba ·
600 sqft ·
Built 1926
· SingleFamily
· Active
· 6 DOM
Cashflow @ list (25.0% down · 7.5%)
Estimated rent
$1,566/mo
Mortgage (P&I)
−$524
Tax + insurance
−$167
HOA
−$148
Vac / Maint / Mgmt
−$329
Net cashflow
$398/mo
Annual
$4,773/yr
Cap rate
11.07%
Cash-on-cash
17.05%
DSCR
1.76
1% rule
1.57%
Cash to close
$28,000
Investor read
- This is a 1-bed/1.0-bath single-family listed at $100k. Condition is rated poor.
- At list price, monthly cash flow is $398 ($5k/yr) — positive.
- The deal already cash-flows at list — no discount required.
- Meets the 1% rule at list price ($2k rent vs $100k).
- Only 6 days on market — expect competitive offers; lowballing is unlikely to land.
- In year one you build about $11k of equity ($691 loan paydown + $10k appreciation (10.0% local appreciation)).
- Location reads 40/100 on livability (#1,386 in CA) — a working-class tenant base; expect higher turnover. Strengths: housing A+, crime A; Watch: amenities F, commute F, employment F.
- Redlands Unified (urban): math 44% / reading 57% proficiency, ranked #390 of 1,400 in CA (top 28%) — acceptable for families but not a draw, mixed tenant base, ~2y average lease.
- Zoned schools: Moore Middle (1,072 students, 63% FRL); Redlands East Valley High (1,853 students, 67% FRL) — zoned schools average 65% FRL vs 48% district-wide (17 pts higher); higher-poverty schools than district average — tighter screening recommended.
- Watch-outs: built in 1926 — expect roof / HVAC / electrical / plumbing capex.
- Market conditions: 21 active listings in the ZIP; 5,458 units permitted in San Bernardino County in 2024 (1,500 in 5+ unit buildings).
- San Bernardino County population projected at +15% by 2050 — modest demand growth; plan on rents tracking national, not racing it.
- At projected returns (10.0% appreciation + 3.0% rent growth), your $28k cash investment doubles in ~2 years — after that, you're playing with house money.
- By year 4, paydown + projected appreciation supports a ~$38k cash-out refi (75% LTV) — recoverable capital for the next deal without selling this one.
- Climate carrying-cost: moderate flood risk; major wildfire risk — expect insurance premiums to compound above CPI over the hold.
- Cap rate 11.1% vs local median 3.6% in Oak Glen — top-decile yield for the area; either an underpriced asset or a hidden risk that comps aren't pricing in. Stress-test before assuming the spread holds.
Questions for listing agent
- Have any recent inspections been done? Can we get a copy of the seller's disclosures and any deferred-maintenance estimates?
- Built in 1926 — when were the roof, HVAC, electrical panel, plumbing, and water heater last replaced?
- What does the HOA fee cover, when was the last increase, and are there any pending special assessments or reserve-fund shortfalls?
- Is there a deadline driving the sale (1031 exchange, divorce, estate, relocation)? That informs how much negotiation room exists.
- Schools are D-rated, which usually means shorter tenancies and higher turnover. Who's the typical renter profile here, and what's been the actual vacancy rate?
- What's the average days-on-market for RENTAL listings here right now (not sales)? A rising rental-DOM trend means longer vacancies and softer asking-rent achievability than the comps imply.
- What's the recent tenant-quality profile in this submarket — average credit score on applications, eviction rate, late-payment / NSF rate, and stable-employment percentage? A property-management company in the area should have these aggregated.
- How much new for-sale + rental construction is in the pipeline within 1–3 miles? Heavy new supply typically softens prices + rents 12–24 months out; constrained supply supports both.
Repairs flagged (vision-AI assessment)
- Major: Exposed wiring — Safety hazard
- Major: Exposed plumbing — Safety hazard
- Major: Exposed subflooring — Structural integrity risk
- Major: Exposed walls — Structural integrity risk
CashFlowRE · CFR-948PDD0CJW87DW
· Data 2 days ago
cashflowre.app · 2026-05-29