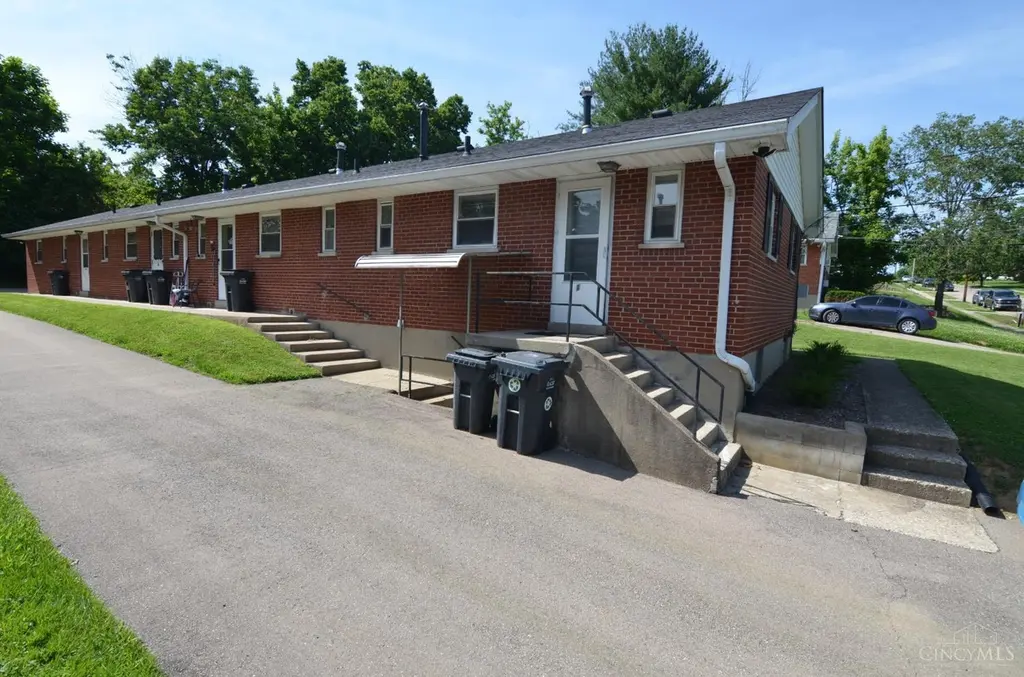
7205 Longfield Dr
Madeira, OH 45243
$449,900B
20 bd · 16.0 ba ·
2,300 sqft ·
Built 1961
· MultiFamily
· Active
· 17 DOM
Cashflow @ list (25.0% down · 7.5%)
Estimated rent
$7,622/mo
Mortgage (P&I)
−$2,359
Tax + insurance
−$994
HOA
−$0
Vac / Maint / Mgmt
−$1,601
Net cashflow
$2,668/mo
Annual
$32,020/yr
Cap rate
13.41%
Cash-on-cash
25.42%
DSCR
2.13
1% rule
1.69%
Cash to close
$125,972
Investor read
- This is a 3×1bd/1ba + 1×2bd/1ba units multifamily listed at $450k.
- At list price, monthly cash flow is $3k ($32k/yr) — positive. Per door: $667/mo.
- The deal already cash-flows at list — no discount required.
- Meets the 1% rule at list price ($8k rent vs $450k).
- It's been on market 17 days — a 2% lower offer ($443k) is reasonable based on typical stale-listing flexibility.
- Recommended offer: $443k (1.5% below list) — sets the bar for market timing.
- Local home prices are declining (-3.0%/yr); year-one equity from $3k of loan paydown is wiped out by about $13k of value loss. Plan a longer hold.
- Location reads 86/100 on livability (#36 in OH, #347 nationally) — a professional / high-income tenant draw. Strengths: schools A+, crime A+, employment A+; Watch: amenities C-, commute D+.
- Madeira City (suburban): math 82% / reading 90% proficiency, ranked #13 of 656 in OH (top 2%) — strong family-tenant draw, lease renewals of 3-5y typical; only 6% free/reduced lunch — higher-income household profile.
- Market conditions: 37 active listings in the ZIP; high-income renter base; 801 units permitted in Hamilton County in 2024 (190 in 5+ unit buildings).
- 2 sale attempts since 16y ago with the ask held roughly flat each time — persistent listings suggest the price (not the market) is what's stuck; bring a comps-based counter.
- Current owner paid $142k; list at $450k implies a 216% gain — meaningful room to come down on a strong offer.
- At projected returns (-3.0% appreciation + 3.0% rent growth), your $126k cash investment doubles in ~5 years — after that, you're playing with house money.
- Cap rate 13.4% vs local median 3.0% in Madeira — top-decile yield for the area; either an underpriced asset or a hidden risk that comps aren't pricing in. Stress-test before assuming the spread holds.
- At $7,622/mo this rent would consume 54% of the median local household income ($170k/yr) (locally 16% of renters already pay >50% of income on rent) — very limited rent-growth headroom before tenants either downsize or default.
Questions for listing agent
- Can we see the unit-by-unit rent roll, current vacancy, and any below-market leases? What's the average tenancy length?
- What capital expenditures (roof, boiler, parking lot, exteriors) have been made in the last 5 years, and what's planned in the next 2?
- Built in 1961 — when were the roof, HVAC, electrical panel, plumbing, and water heater last replaced?
- Is there a deadline driving the sale (1031 exchange, divorce, estate, relocation)? That informs how much negotiation room exists.
- Schools are A-rated — typically a magnet for longer-tenancy family renters. What's the average tenant stay here, and is there a school-zone premium baked into asking?
- What's the average days-on-market for RENTAL listings here right now (not sales)? A rising rental-DOM trend means longer vacancies and softer asking-rent achievability than the comps imply.
- What's the recent tenant-quality profile in this submarket — average credit score on applications, eviction rate, late-payment / NSF rate, and stable-employment percentage? A property-management company in the area should have these aggregated.
- How much new apartment / multifamily construction is in the pipeline within 1–3 miles? Heavy new supply (>2% of stock underway) typically softens rents 12–24 months out; light construction supports rent growth.
CashFlowRE · CFR-96EY0Y307DVMYA
· Data 2 days ago
cashflowre.app · 2026-05-29