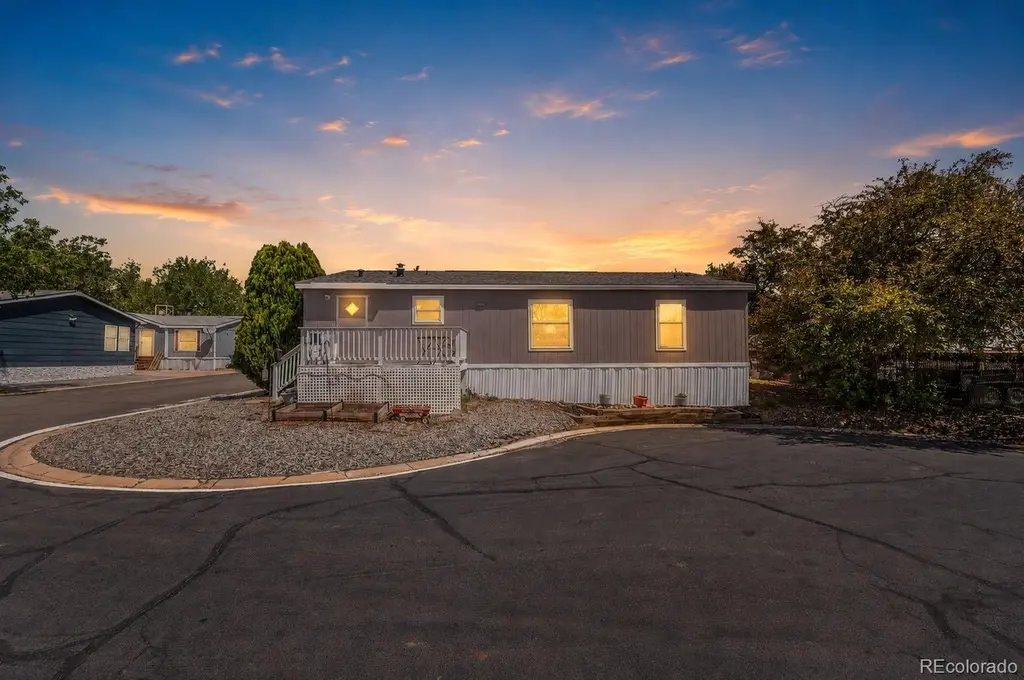
860 W 132nd Ave
Westminster, CO 80234
$95,000B-
3 bd · 2.0 ba ·
7,661 sqft ·
Built 2012
· SingleFamily
· Active
· 11 DOM
Cashflow @ list (25.0% down · 7.5%)
Estimated rent
$2,425/mo
Mortgage (P&I)
−$498
Tax + insurance
−$158
HOA
−$0
Vac / Maint / Mgmt
−$509
Net cashflow
$1,260/mo
Annual
$15,114/yr
Cap rate
22.20%
Cash-on-cash
56.82%
DSCR
3.53
1% rule
2.55%
Cash to close
$26,600
Investor read
- This is a 3-bed/2.0-bath single-family listed at $95k.
- At list price, monthly cash flow is $1k ($15k/yr) — positive.
- The deal already cash-flows at list — no discount required.
- Meets the 1% rule at list price ($2k rent vs $95k).
- Only 11 days on market — expect competitive offers; lowballing is unlikely to land.
- Local home prices are declining (-3.0%/yr); year-one equity from $657 of loan paydown is wiped out by about $3k of value loss. Plan a longer hold.
- Location reads 70/100 on livability (#81 in CO) — a middle-class / working-renter tenant base. Strengths: employment A+, housing A+; Watch: health & safety D, crime D-, amenities F.
- Adams 12 Five Star Schools (suburban): math 31% / reading 46% proficiency, ranked #26 of 86 in CO (top 30%) — families likely to look elsewhere, expect single-tenant / working-renter base with shorter leases.
- Zoned schools: Arapahoe Ridge Elementary School (math 30% / reading 32%, grade F, #496 of 966 statewide, top 52%, 500 students, 53% FRL); Silver Hills Middle School (math 16% / reading 32%, grade F, #178 of 270 statewide, top 67%, 957 students, 70% FRL); Legacy High School (math 59% / reading 73%, grade B, #30 of 381 statewide, top 8%, 2,230 students, 22% FRL) — zoned schools average 48% FRL vs 33% district-wide (15 pts higher); higher-poverty schools than district average — tighter screening recommended.
- Market conditions: Rents falling (-3.0%/yr); 142 active listings in the ZIP; solid renter incomes; 2,299 units permitted in Adams County in 2024 (343 in 5+ unit buildings).
- Adams County population projected at +44% by 2050 — long-run rental-demand tailwind backs the buy-and-hold thesis.
- 11 sale attempts since 4y ago; this cycle's ask is 4926% above the opening price — seller raised mid-cycle; expect resistance to lowballs.
- At projected returns (-3.0% appreciation + 0.0% rent growth), your $27k cash investment doubles in ~3 years — after that, you're playing with house money.
- Cap rate 22.2% vs local median 2.8% in Westminster — top-decile yield for the area; either an underpriced asset or a hidden risk that comps aren't pricing in. Stress-test before assuming the spread holds.
- This rent runs 31% of the median local income ($93k/yr) — at the standard rent-burdened threshold; future hikes will face affordability resistance.
Questions for listing agent
- Is there a deadline driving the sale (1031 exchange, divorce, estate, relocation)? That informs how much negotiation room exists.
- Crime grade is D in this area — have there been break-ins, vandalism, or insurance claims at this property in the last 3 years? What carrier currently insures it and at what premium?
- What's the average days-on-market for RENTAL listings here right now (not sales)? A rising rental-DOM trend means longer vacancies and softer asking-rent achievability than the comps imply.
- What's the recent tenant-quality profile in this submarket — average credit score on applications, eviction rate, late-payment / NSF rate, and stable-employment percentage? A property-management company in the area should have these aggregated.
- How much new for-sale + rental construction is in the pipeline within 1–3 miles? Heavy new supply typically softens prices + rents 12–24 months out; constrained supply supports both.
CashFlowRE · CFR-976A0ECHFF3J07
· Data 2 days ago
cashflowre.app · 2026-05-29