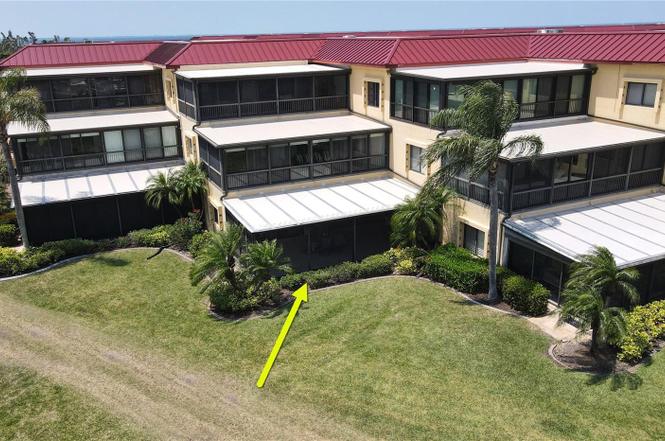
3260 Southshore Dr Unit 65A
Burnt Store Marina, FL 33955
$283,000C-
3 bd · 2.0 ba ·
2,069 sqft ·
Built 1981
· Condo
· Active
· 145 DOM
Cashflow @ list (25.0% down · 7.5%)
Estimated rent
$4,976/mo
Mortgage (P&I)
−$1,484
Tax + insurance
−$834
HOA
−$1,881
Vac / Maint / Mgmt
−$1,045
Net cashflow
$-268/mo
Annual
$-3,220/yr
Cap rate
6.96%
Cash-on-cash
2.40%
DSCR
1.11
1% rule
1.76%
Cash to close
$79,240
Investor read
- This is a 3-bed/2.0-bath condo listed at $283k.
- At list price, monthly cash flow is $-268 ($-3k/yr) — negative.
- To cash-flow at today's rent, offer at most $236k (16.7% below list).
- Meets the 1% rule at list price ($5k rent vs $283k).
- It's been on market 145 days — a 12% lower offer ($249k) is reasonable based on typical stale-listing flexibility.
- Recommended offer: $236k (16.7% below list) — sets the bar for cash-flow.
- Local home prices are declining (-3.0%/yr); year-one equity from $2k of loan paydown is wiped out by about $8k of value loss. Plan a longer hold.
- Location reads 72/100 on livability (#354 in FL) — a middle-class / working-renter tenant base. Strengths: crime A+, employment A+, housing A+; Watch: schools C-, cost of living C-, amenities F.
- Lee (suburban): math 47% / reading 50% proficiency, ranked #42 of 73 in FL (top 58%) — families likely to look elsewhere, expect single-tenant / working-renter base with shorter leases.
- Watch-outs: flood insurance adds $427/mo; HOA is 38% of rent.
- Market conditions: 1481 active listings in the ZIP; 19 comparable units currently listed for rent nearby; rentals at typical pace (median 24d on market — plan ~3-4 weeks tenant-placement turnaround); solid renter incomes; 15,411 units permitted in Lee County in 2024 (4,686 in 5+ unit buildings).
- Lee County population projected at +44% by 2050 — long-run rental-demand tailwind backs the buy-and-hold thesis.
- 6 sale attempts since 19y ago; this cycle's ask has dropped $27k (9%) from the opening price — seller is motivated, your offer sets the floor, not the list.
- Current owner paid $148k; list at $283k implies a 91% gain — meaningful room to come down on a strong offer.
- Climate carrying-cost: in FEMA flood zone AE (mandatory federal flood insurance); severe wind risk, 99% chance of damaging wind over 30y; major wildfire risk; extreme-heat days projected 7→31/yr by 2055 (HVAC capex compounding) — expect insurance premiums to compound above CPI over the hold.
- Cap rate 7.0% vs local median 4.8% in Burnt Store Marina — top-decile yield for the area; either an underpriced asset or a hidden risk that comps aren't pricing in. Stress-test before assuming the spread holds.
- At $4,976/mo this rent would consume 78% of the median local household income ($77k/yr) (locally 226% of renters already pay >50% of income on rent) — very limited rent-growth headroom before tenants either downsize or default.
Questions for listing agent
- What do current leases actually rent for vs. the listed asking? Can we see a recent rent roll and the last 12 months of T-12 income?
- It's been on market 145 days. Have you received any prior offers? Is the seller open to a 17% concession, seller financing, or rate buy-down credit?
- What's the actual annual flood-insurance premium (NFIP or private), and is the property in a SFHA with mandatory coverage?
- What does the HOA fee cover, when was the last increase, and are there any pending special assessments or reserve-fund shortfalls?
- Any open or pending special assessments — roof, HVAC, plumbing, elevator, façade? What's the per-unit balance and payoff schedule, and is the seller paying it off at close or rolling it to the buyer?
- Why hasn't it sold? Are there any deal-killer items the seller is aware of (foundation, flood, title, zoning, code violations)?
- Is there a deadline driving the sale (1031 exchange, divorce, estate, relocation)? That informs how much negotiation room exists.
- What's the average days-on-market for RENTAL listings here right now (not sales)? A rising rental-DOM trend means longer vacancies and softer asking-rent achievability than the comps imply.
CashFlowRE · CFR-97WY2N1PJS320H
· Data 3 days ago
cashflowre.app · 2026-05-29