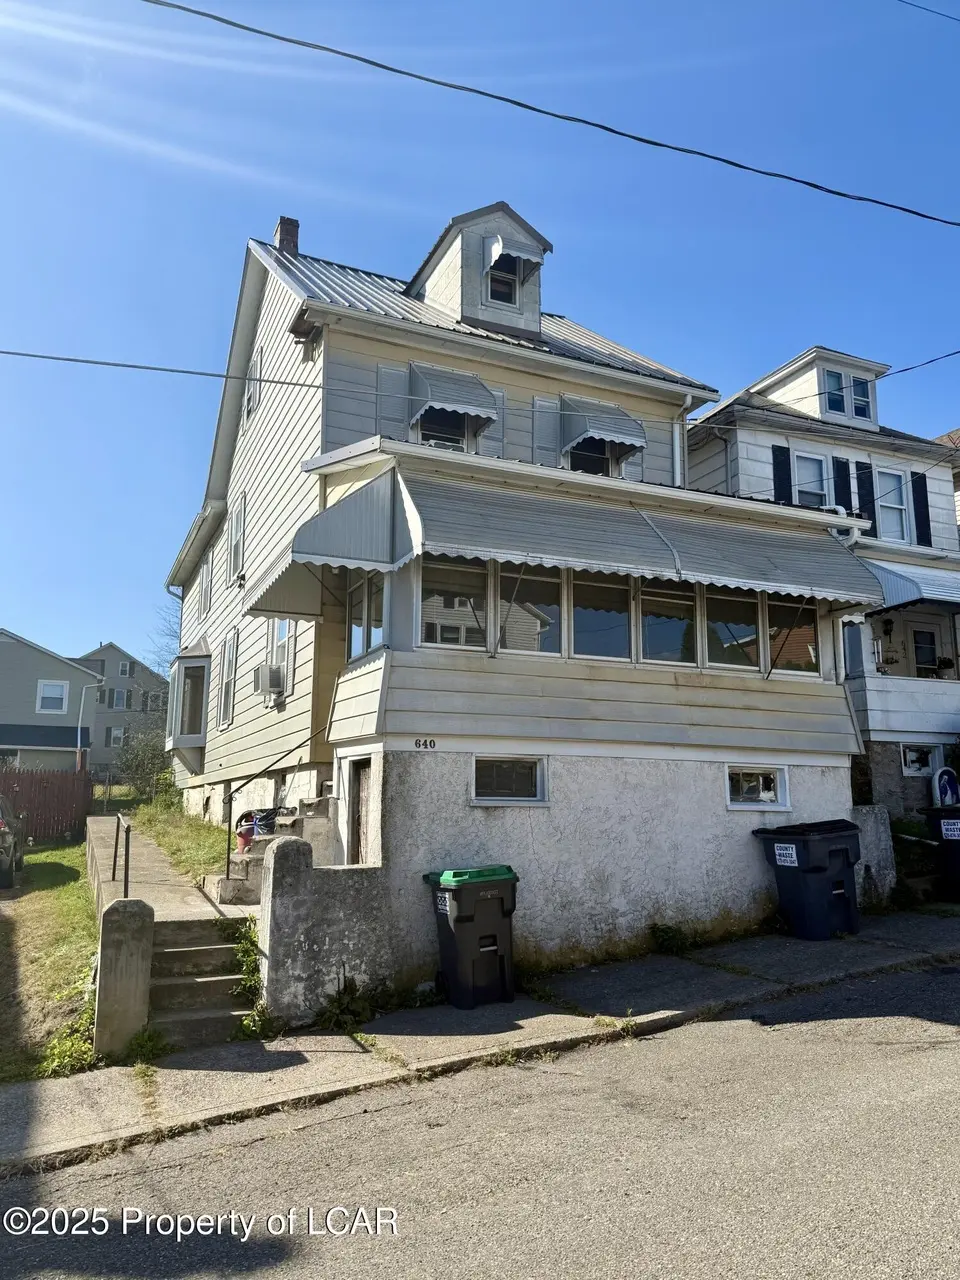
640 Vine St
Freeland, PA 18224
$229,000D
4 bd · 1.5 ba ·
1,980 sqft ·
Built 1925
· SingleFamily
· Pending
· 7 DOM
Cashflow @ list (25.0% down · 7.5%)
Estimated rent
$1,737/mo
Mortgage (P&I)
−$1,201
Tax + insurance
−$251
HOA
−$0
Vac / Maint / Mgmt
−$365
Net cashflow
$-80/mo
Annual
$-960/yr
Cap rate
5.87%
Cash-on-cash
-1.50%
DSCR
0.93
1% rule
0.76%
Cash to close
$64,120
Investor read
- This is a 4-bed/1.5-bath single-family listed at $229k.
- At list price, monthly cash flow is $-80 ($-960/yr) — negative.
- To cash-flow at today's rent, offer at most $215k (6.2% below list).
- To meet the 1% rule (rent ≥ 1% of price), the offer needs to be $174k (24.2% below list).
- Only 7 days on market — expect competitive offers; lowballing is unlikely to land.
- Recommended offer: $174k (24.2% below list) — sets the bar for 1% rule.
- In year one you build about $24k of equity ($2k loan paydown + $23k appreciation (10.0% local appreciation)).
- Location reads 61/100 on livability (#1,409 in PA) — a middle-class / working-renter tenant base. Strengths: cost of living A+, crime A, housing A-; Watch: amenities F, commute F, employment F.
- Hazleton Area SD (suburban): math 18% / reading 30% proficiency, ranked #476 of 539 in PA (top 88%) — low school quality limits family demand, transient renter base, plan for 1-2y turnover.
- Zoned schools: Freeland El/Ms (math 8% / reading 27%, grade F, #1,295 of 1,518 statewide, top 86%, 951 students, 100% FRL); Hazleton Area Hs (math 53% / reading 8%, grade F, #347 of 437 statewide, top 79%, 3,795 students, 83% FRL) — zoned schools average 91% FRL vs 60% district-wide (32 pts higher); higher-poverty schools than district average — tighter screening recommended.
- Watch-outs: built in 1925 — expect roof / HVAC / electrical / plumbing capex.
- Market conditions: 43 active listings in the ZIP; 349 units permitted in Luzerne County in 2024 (16 in 5+ unit buildings).
- Luzerne County population projected at +4% by 2050 — modest demand growth; plan on rents tracking national, not racing it.
- 6 sale attempts since 16y ago with the ask held roughly flat each time — persistent listings suggest the price (not the market) is what's stuck; bring a comps-based counter.
- Current owner paid $125k; list at $229k implies a 83% gain — meaningful room to come down on a strong offer.
- At projected returns (10.0% appreciation + 3.0% rent growth), your $64k cash investment doubles in ~3 years — after that, you're playing with house money.
- By year 2, paydown + projected appreciation supports a ~$39k cash-out refi (75% LTV) — recoverable capital for the next deal without selling this one.
Questions for listing agent
- What do current leases actually rent for vs. the listed asking? Can we see a recent rent roll and the last 12 months of T-12 income?
- Built in 1925 — when were the roof, HVAC, electrical panel, plumbing, and water heater last replaced?
- Is there a deadline driving the sale (1031 exchange, divorce, estate, relocation)? That informs how much negotiation room exists.
- Schools are F-rated, which usually means shorter tenancies and higher turnover. Who's the typical renter profile here, and what's been the actual vacancy rate?
- The area grade is low — what's the realistic commute time and amenity access for the typical tenant pool here? Any planned neighborhood developments (good or bad) we should know about?
- What's the average days-on-market for RENTAL listings here right now (not sales)? A rising rental-DOM trend means longer vacancies and softer asking-rent achievability than the comps imply.
- What's the recent tenant-quality profile in this submarket — average credit score on applications, eviction rate, late-payment / NSF rate, and stable-employment percentage? A property-management company in the area should have these aggregated.
- How much new for-sale + rental construction is in the pipeline within 1–3 miles? Heavy new supply typically softens prices + rents 12–24 months out; constrained supply supports both.
CashFlowRE · CFR-9BHPKJ2K0XHDB2
· Data 4 weeks ago
cashflowre.app · 2026-05-29