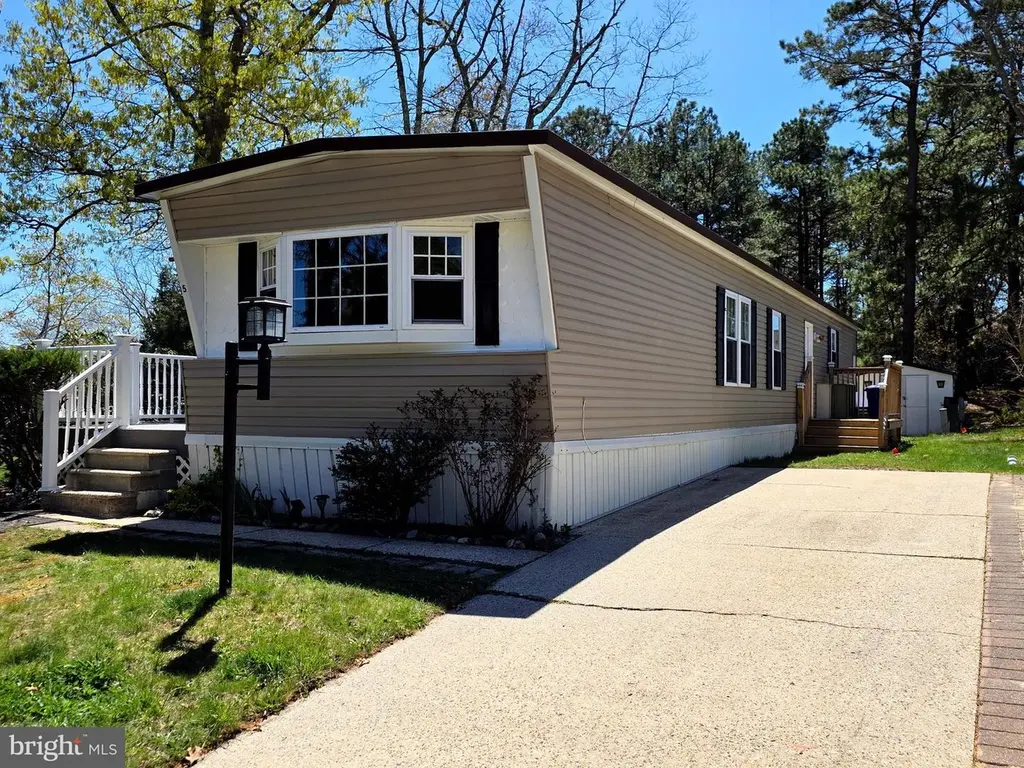
5 Ruth Rd
Ocean Acres, NJ 08005
$124,900D+
2 bd · 2.0 ba ·
1,000 sqft ·
Built 1978
· SingleFamily
· Active
· 55 DOM
Cashflow @ list (25.0% down · 7.5%)
Estimated rent
$2,365/mo
Mortgage (P&I)
−$655
Tax + insurance
−$208
HOA
−$827
Vac / Maint / Mgmt
−$497
Net cashflow
$178/mo
Annual
$2,138/yr
Cap rate
8.00%
Cash-on-cash
6.11%
DSCR
1.27
1% rule
1.89%
Cash to close
$34,972
Investor read
- This is a 2-bed/2.0-bath single-family listed at $125k.
- At list price, monthly cash flow is $178 ($2k/yr) — positive.
- The deal already cash-flows at list — no discount required.
- Meets the 1% rule at list price ($2k rent vs $125k).
- It's been on market 55 days — a 3% lower offer ($121k) is reasonable based on typical stale-listing flexibility.
- Recommended offer: $121k (3.0% below list) — sets the bar for market timing.
- Local home prices are declining (-3.0%/yr); year-one equity from $864 of loan paydown is wiped out by about $4k of value loss. Plan a longer hold.
- Location reads 63/100 on livability (#425 in NJ) — a middle-class / working-renter tenant base. Strengths: employment A+, housing A+; Watch: schools C-, amenities F, commute F.
- Barnegat Township School District (suburban): math 23% / reading 46% proficiency, ranked #285 of 472 in NJ (top 60%) — families likely to look elsewhere, expect single-tenant / working-renter base with shorter leases.
- Watch-outs: HOA is 35% of rent.
- Market conditions: 253 active listings in the ZIP; solid renter incomes; 4,434 units permitted in Ocean County in 2024 (868 in 5+ unit buildings).
- Ocean County population projected to shrink 8% by 2050 — rents likely to lag national; underwrite the cash flow, not the appreciation.
- 5 sale attempts since 18y ago; this cycle's ask has dropped $15k (11%) from the opening price — seller is motivated, your offer sets the floor, not the list.
- Current owner paid $10k; list at $125k implies a 1149% gain — meaningful room to come down on a strong offer.
- Cap rate 8.0% vs local median 3.2% in Ocean Acres — top-decile yield for the area; either an underpriced asset or a hidden risk that comps aren't pricing in. Stress-test before assuming the spread holds.
- This rent runs 30% of the median local income ($94k/yr) — at the standard rent-burdened threshold; future hikes will face affordability resistance.
Questions for listing agent
- It's been on market 55 days. Have you received any prior offers? Is the seller open to a 3% concession, seller financing, or rate buy-down credit?
- Built in 1978 — when were the roof, HVAC, electrical panel, plumbing, and water heater last replaced?
- What does the HOA fee cover, when was the last increase, and are there any pending special assessments or reserve-fund shortfalls?
- Is there a deadline driving the sale (1031 exchange, divorce, estate, relocation)? That informs how much negotiation room exists.
- The area grade is low — what's the realistic commute time and amenity access for the typical tenant pool here? Any planned neighborhood developments (good or bad) we should know about?
- What's the average days-on-market for RENTAL listings here right now (not sales)? A rising rental-DOM trend means longer vacancies and softer asking-rent achievability than the comps imply.
- What's the recent tenant-quality profile in this submarket — average credit score on applications, eviction rate, late-payment / NSF rate, and stable-employment percentage? A property-management company in the area should have these aggregated.
- How much new for-sale + rental construction is in the pipeline within 1–3 miles? Heavy new supply typically softens prices + rents 12–24 months out; constrained supply supports both.
CashFlowRE · CFR-9BP2APCSXQA3WQ
· Data 1 day ago
cashflowre.app · 2026-05-29