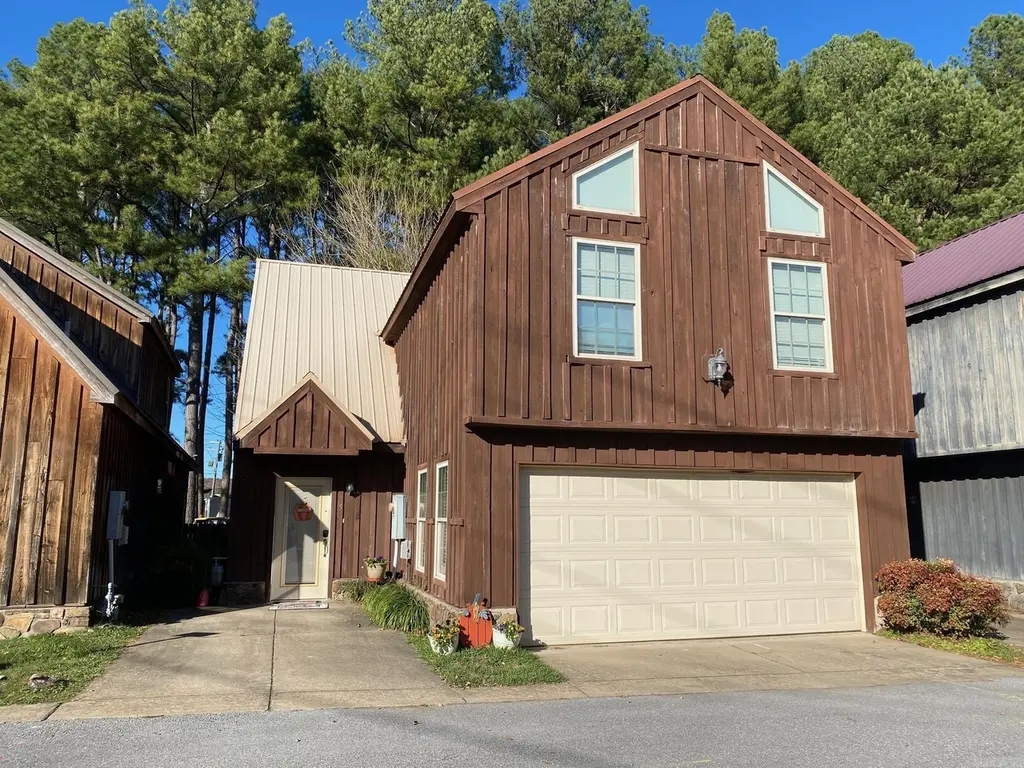
5 Jared Cir
Heber Springs, AR 72543
$189,000D
3 bd · 2.0 ba ·
1,804 sqft ·
Built 2008
· SingleFamily
· Active
· 152 DOM
Cashflow @ list (25.0% down · 7.5%)
Estimated rent
$1,340/mo
Mortgage (P&I)
−$991
Tax + insurance
−$212
HOA
−$0
Vac / Maint / Mgmt
−$281
Net cashflow
$-145/mo
Annual
$-1,740/yr
Cap rate
5.37%
Cash-on-cash
-3.29%
DSCR
0.85
1% rule
0.71%
Cash to close
$52,920
Investor read
- This is a 3-bed/2.0-bath single-family listed at $189k.
- At list price, monthly cash flow is $-145 ($-2k/yr) — negative.
- To cash-flow at today's rent, offer at most $163k (13.5% below list).
- To meet the 1% rule (rent ≥ 1% of price), the offer needs to be $134k (29.1% below list).
- It's been on market 152 days — a 12% lower offer ($166k) is reasonable based on typical stale-listing flexibility.
- Recommended offer: $134k (29.1% below list) — sets the bar for 1% rule.
- Local home prices are declining (-3.0%/yr); year-one equity from $1k of loan paydown is wiped out by about $6k of value loss. Plan a longer hold.
- Location reads 58/100 on livability (#329 in AR) — a working-class tenant base; expect higher turnover. Strengths: cost of living A+; Watch: crime C-, employment D+, amenities F.
- Heber Springs School District (town): math 50% / reading 49% proficiency, ranked #19 of 238 in AR (top 8%) — families likely to look elsewhere, expect single-tenant / working-renter base with shorter leases.
- Zoned schools: Heber Springs Elem. School (math 48% / reading 40%, grade F, #164 of 454 statewide, top 37%, 756 students, 61% FRL); Heber Springs Middle School (math 60% / reading 58%, grade B, #13 of 201 statewide, top 7%, 380 students, 46% FRL); Heber Springs High School (math 37% / reading 49%, grade F, #37 of 292 statewide, top 12%, 484 students, 40% FRL) — zoned schools at 49% FRL track the district average.
- Market conditions: 296 active listings in the ZIP; 13 units permitted in Cleburne County in 2024 (0 in 5+ unit buildings).
- Cleburne County population projected at -18% by 2050 — secular population decline; favor cash flow + early exit over multi-decade hold.
- 10 sale attempts since 13y ago; this cycle's ask has dropped $31k (14%) from the opening price — seller is motivated, your offer sets the floor, not the list.
- Climate carrying-cost: moderate wildfire risk; extreme-heat days projected 7→20/yr by 2055 (HVAC capex compounding) — expect insurance premiums to compound above CPI over the hold.
- Cap rate 5.4% vs local median 2.1% in Heber Springs — top-decile yield for the area; either an underpriced asset or a hidden risk that comps aren't pricing in. Stress-test before assuming the spread holds.
Questions for listing agent
- What do current leases actually rent for vs. the listed asking? Can we see a recent rent roll and the last 12 months of T-12 income?
- It's been on market 152 days. Have you received any prior offers? Is the seller open to a 29% concession, seller financing, or rate buy-down credit?
- Why hasn't it sold? Are there any deal-killer items the seller is aware of (foundation, flood, title, zoning, code violations)?
- Is there a deadline driving the sale (1031 exchange, divorce, estate, relocation)? That informs how much negotiation room exists.
- The area grade is low — what's the realistic commute time and amenity access for the typical tenant pool here? Any planned neighborhood developments (good or bad) we should know about?
- What's the average days-on-market for RENTAL listings here right now (not sales)? A rising rental-DOM trend means longer vacancies and softer asking-rent achievability than the comps imply.
- What's the recent tenant-quality profile in this submarket — average credit score on applications, eviction rate, late-payment / NSF rate, and stable-employment percentage? A property-management company in the area should have these aggregated.
- How much new for-sale + rental construction is in the pipeline within 1–3 miles? Heavy new supply typically softens prices + rents 12–24 months out; constrained supply supports both.
CashFlowRE · CFR-9CFDZY0B9DV338
· Data 2 h ago
cashflowre.app · 2026-05-29