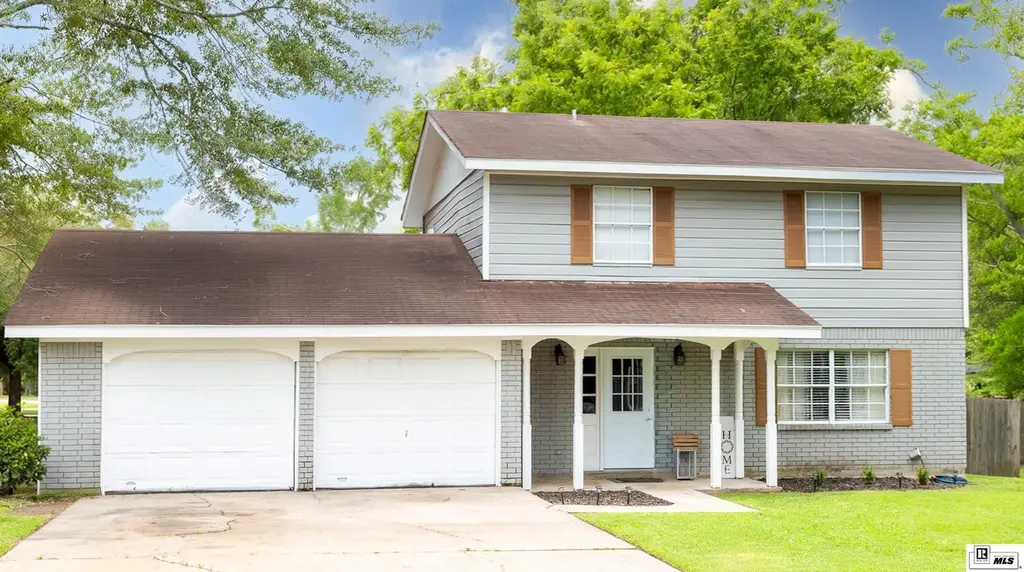
101 Lakewood Cir
Swartz, LA 71203
$200,000C+
4 bd · 2.0 ba ·
1,839 sqft ·
Built 1974
· SingleFamily
· Pending
· 7 DOM
Cashflow @ list (25.0% down · 7.5%)
Estimated rent
$2,320/mo
Mortgage (P&I)
−$1,049
Tax + insurance
−$303
HOA
−$0
Vac / Maint / Mgmt
−$487
Net cashflow
$481/mo
Annual
$5,775/yr
Cap rate
9.18%
Cash-on-cash
10.31%
DSCR
1.46
1% rule
1.16%
Cash to close
$56,000
Investor read
- This is a 4-bed/2.0-bath single-family listed at $200k.
- At list price, monthly cash flow is $481 ($6k/yr) — positive.
- The deal already cash-flows at list — no discount required.
- Meets the 1% rule at list price ($2k rent vs $200k).
- Only 7 days on market — expect competitive offers; lowballing is unlikely to land.
- Local home prices are declining (-3.0%/yr); year-one equity from $1k of loan paydown is wiped out by about $6k of value loss. Plan a longer hold.
- Location reads 64/100 on livability (#184 in LA) — a middle-class / working-renter tenant base. Strengths: cost of living A+, housing A+; Watch: crime C-, health & safety D, amenities F.
- Ouachita Parish (suburban): math 31% / reading 45% proficiency, ranked #26 of 98 in LA (top 26%) — families likely to look elsewhere, expect single-tenant / working-renter base with shorter leases.
- Zoned schools: Lakeshore School (math 15% / reading 31%, grade F, #408 of 646 statewide, top 64%, 570 students, 75% FRL); East Ouachita Middle School (math 21% / reading 43%, grade F, #107 of 218 statewide, top 49%, 540 students, 69% FRL) — zoned schools average 72% FRL vs 52% district-wide (21 pts higher); higher-poverty schools than district average — tighter screening recommended.
- Market conditions: 437 active listings in the ZIP; 2 comparable units currently listed for rent nearby; 345 units permitted in Ouachita Parish in 2024 (0 in 5+ unit buildings).
- 2 sale attempts since 11y ago with the ask held roughly flat each time — persistent listings suggest the price (not the market) is what's stuck; bring a comps-based counter.
- Current owner paid $145k; 38% above their basis — modest negotiation headroom, anchor on the comps not their cost.
- Climate carrying-cost: major wind risk, 74% chance of damaging wind over 30y; extreme-heat days projected 7→20/yr by 2055 (HVAC capex compounding) — expect insurance premiums to compound above CPI over the hold.
- Cap rate 9.2% vs local median 6.2% in Swartz — top-decile yield for the area; either an underpriced asset or a hidden risk that comps aren't pricing in. Stress-test before assuming the spread holds.
- At $2,320/mo this rent would consume 53% of the median local household income ($52k/yr) (locally 2085% of renters already pay >50% of income on rent) — very limited rent-growth headroom before tenants either downsize or default.
Questions for listing agent
- Built in 1974 — when were the roof, HVAC, electrical panel, plumbing, and water heater last replaced?
- Is there a deadline driving the sale (1031 exchange, divorce, estate, relocation)? That informs how much negotiation room exists.
- What's the average days-on-market for RENTAL listings here right now (not sales)? A rising rental-DOM trend means longer vacancies and softer asking-rent achievability than the comps imply.
- What's the recent tenant-quality profile in this submarket — average credit score on applications, eviction rate, late-payment / NSF rate, and stable-employment percentage? A property-management company in the area should have these aggregated.
- How much new for-sale + rental construction is in the pipeline within 1–3 miles? Heavy new supply typically softens prices + rents 12–24 months out; constrained supply supports both.
CashFlowRE · CFR-9CPX436P7B882T
· Data 3 weeks ago
cashflowre.app · 2026-05-29