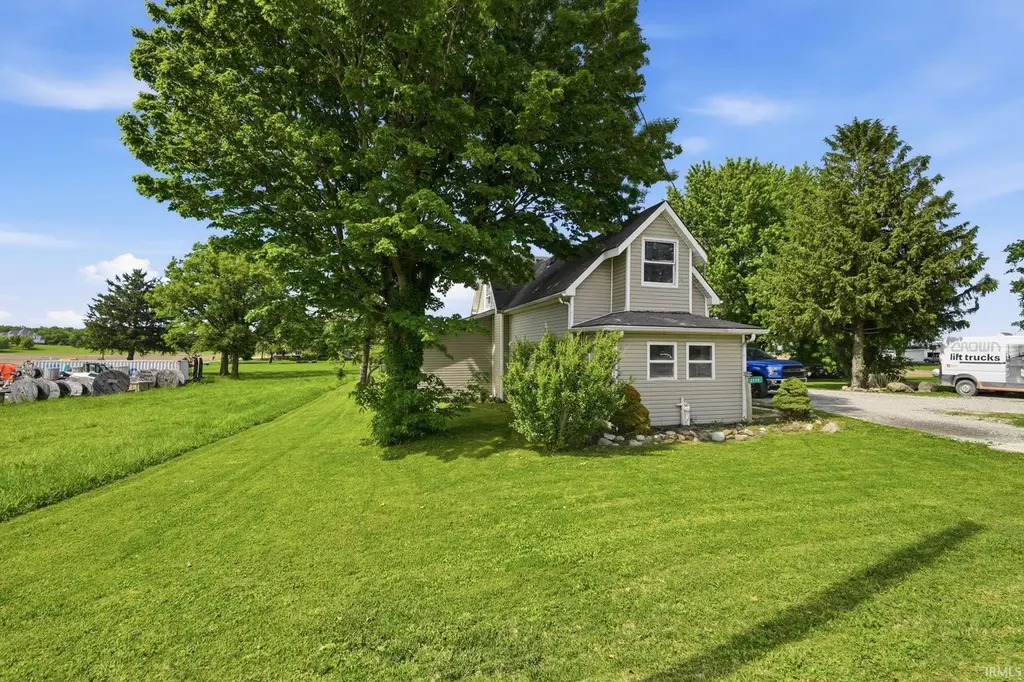
2058 E State Road 26 Rd
Frankfort, IN 46041
$160,000D+
3 bd · 1.0 ba ·
1,436 sqft ·
Built 1900
· SingleFamily
· Active
· 13 DOM
Cashflow @ list (25.0% down · 7.5%)
Estimated rent
$1,413/mo
Mortgage (P&I)
−$839
Tax + insurance
−$100
HOA
−$0
Vac / Maint / Mgmt
−$297
Net cashflow
$177/mo
Annual
$2,122/yr
Cap rate
7.62%
Cash-on-cash
4.74%
DSCR
1.21
1% rule
0.88%
Cash to close
$44,800
Investor read
- This is a 3-bed/1.0-bath single-family listed at $160k.
- At list price, monthly cash flow is $177 ($2k/yr) — positive.
- The deal already cash-flows at list — no discount required.
- To meet the 1% rule (rent ≥ 1% of price), the offer needs to be $141k (11.7% below list).
- Only 13 days on market — expect competitive offers; lowballing is unlikely to land.
- Recommended offer: $141k (11.7% below list) — sets the bar for 1% rule.
- Local home prices are declining (-3.0%/yr); year-one equity from $1k of loan paydown is wiped out by about $5k of value loss. Plan a longer hold.
- Location reads 73/100 on livability (#107 in IN) — a middle-class / working-renter tenant base. Strengths: crime A+, cost of living A+, housing A+; Watch: amenities F, commute F, employment D-.
- Clinton Central School Corporation (rural): math 38% / reading 46% proficiency, ranked #112 of 301 in IN (top 37%) — families likely to look elsewhere, expect single-tenant / working-renter base with shorter leases.
- Zoned schools: Clinton Central Elementary School (math 49% / reading 45%, grade D-, #325 of 994 statewide, top 36%, 469 students, 57% FRL); Clinton Central Junior-Senior Hs (math 28% / reading 48%, grade F, #243 of 369 statewide, top 66%, 398 students, 45% FRL) — zoned schools average 51% FRL vs 33% district-wide (18 pts higher); higher-poverty schools than district average — tighter screening recommended.
- Watch-outs: built in 1900 — expect roof / HVAC / electrical / plumbing capex.
- Market conditions: 129 active listings in the ZIP; 59 units permitted in Clinton County in 2024 (0 in 5+ unit buildings).
- Clinton County population projected at -15% by 2050 — secular population decline; favor cash flow + early exit over multi-decade hold.
- Cap rate 7.6% vs local median 3.9% in Frankfort — top-decile yield for the area; either an underpriced asset or a hidden risk that comps aren't pricing in. Stress-test before assuming the spread holds.
Questions for listing agent
- Built in 1900 — when were the roof, HVAC, electrical panel, plumbing, and water heater last replaced?
- Is there a deadline driving the sale (1031 exchange, divorce, estate, relocation)? That informs how much negotiation room exists.
- Schools are F-rated, which usually means shorter tenancies and higher turnover. Who's the typical renter profile here, and what's been the actual vacancy rate?
- The area grade is low — what's the realistic commute time and amenity access for the typical tenant pool here? Any planned neighborhood developments (good or bad) we should know about?
- What's the average days-on-market for RENTAL listings here right now (not sales)? A rising rental-DOM trend means longer vacancies and softer asking-rent achievability than the comps imply.
- What's the recent tenant-quality profile in this submarket — average credit score on applications, eviction rate, late-payment / NSF rate, and stable-employment percentage? A property-management company in the area should have these aggregated.
- How much new for-sale + rental construction is in the pipeline within 1–3 miles? Heavy new supply typically softens prices + rents 12–24 months out; constrained supply supports both.
CashFlowRE · CFR-9GHBKY3XAXB53K
· Data 2 days ago
cashflowre.app · 2026-05-29