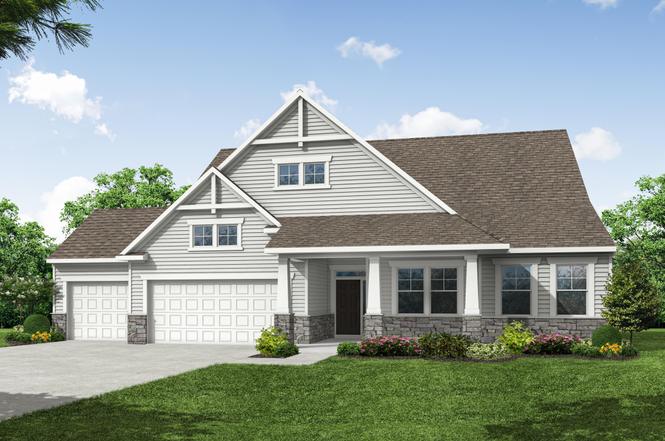
Sullivan Plan
Charleston, SC 29450
$519,990F
3 bd · 2.0 ba ·
2,160 sqft ·
Built —
· SingleFamily
· Active
· 185 DOM
Cashflow @ list (25.0% down · 7.5%)
Estimated rent
$2,995/mo
Mortgage (P&I)
−$3,058
Tax + insurance
−$972
HOA
−$0
Vac / Maint / Mgmt
−$629
Net cashflow
$-1,664/mo
Annual
$-19,972/yr
Cap rate
2.87%
Cash-on-cash
-12.23%
DSCR
0.46
1% rule
0.51%
Cash to close
$163,296
Investor read
- This is a 3-bed/2.0-bath single-family listed at $520k.
- At list price, monthly cash flow is $-2k ($-20k/yr) — negative.
- To cash-flow at today's rent, offer at most $342k (34.2% below list).
- To meet the 1% rule (rent ≥ 1% of price), the offer needs to be $300k (42.4% below list).
- It's been on market 185 days — a 12% lower offer ($458k) is reasonable based on typical stale-listing flexibility.
- Recommended offer: $300k (42.4% below list) — sets the bar for 1% rule.
- Local home prices are declining (-1.1%/yr); year-one equity from $4k of loan paydown is wiped out by about $7k of value loss. Plan a longer hold.
- Location reads 76/100 on livability (#22 in SC, #3,336 nationally) — a middle-class / working-renter tenant base. Strengths: amenities A+, housing A+, health & safety A+; Watch: crime D+, commute F, cost of living D-.
- Berkeley 01 (suburban): math 35% / reading 48% proficiency, ranked #30 of 80 in SC (top 38%) — families likely to look elsewhere, expect single-tenant / working-renter base with shorter leases.
- Zoned schools: Cainhoy Elementary (math 2% / reading 12%, grade F, #594 of 597 statewide, top 100%, 154 students, 100% FRL); Timberland High (math 17% / reading 72%, grade F, #166 of 196 statewide, top 87%, 704 students, 100% FRL) — zoned schools average 100% FRL vs 48% district-wide (52 pts higher); higher-poverty schools than district average — tighter screening recommended.
- Zoned-school proficiency averages 26% at this address vs 42% district-wide (-16 pts) — the specific schools serving this property underperform the Berkeley 01 average; the district grade overstates school quality for this exact location.
- Market conditions: 67 active listings in the ZIP; 1 comparable units currently listed for rent nearby; 3,183 units permitted in Berkeley County in 2024 (580 in 5+ unit buildings).
- Berkeley County population projected at +48% by 2050 — long-run rental-demand tailwind backs the buy-and-hold thesis.
- Cap rate 2.9% vs local median 2.4% in Charleston — meaningfully above typical; check what's discounted (condition, days-on-market, listing class) to confirm the premium yield is real.
Questions for listing agent
- What do current leases actually rent for vs. the listed asking? Can we see a recent rent roll and the last 12 months of T-12 income?
- It's been on market 185 days. Have you received any prior offers? Is the seller open to a 42% concession, seller financing, or rate buy-down credit?
- Why hasn't it sold? Are there any deal-killer items the seller is aware of (foundation, flood, title, zoning, code violations)?
- Is there a deadline driving the sale (1031 exchange, divorce, estate, relocation)? That informs how much negotiation room exists.
- Schools are A-rated — typically a magnet for longer-tenancy family renters. What's the average tenant stay here, and is there a school-zone premium baked into asking?
- Crime grade is D in this area — have there been break-ins, vandalism, or insurance claims at this property in the last 3 years? What carrier currently insures it and at what premium?
- The area grade is low — what's the realistic commute time and amenity access for the typical tenant pool here? Any planned neighborhood developments (good or bad) we should know about?
- What's the average days-on-market for RENTAL listings here right now (not sales)? A rising rental-DOM trend means longer vacancies and softer asking-rent achievability than the comps imply.
CashFlowRE · CFR-9H3YPA7CTHVRC6
· Data 22 h ago
cashflowre.app · 2026-05-29