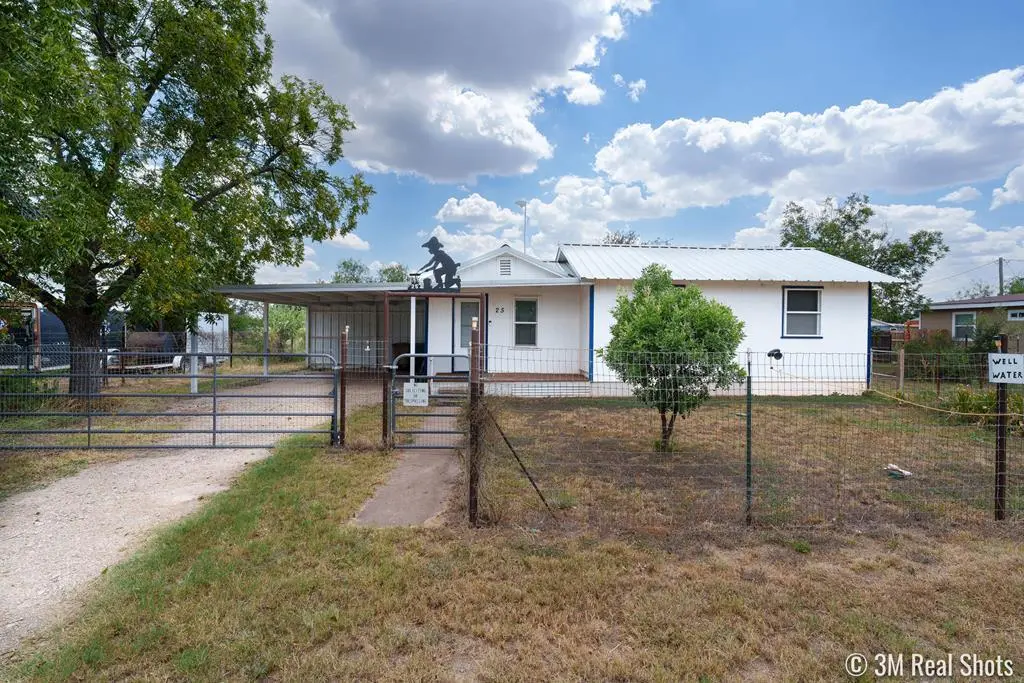
25 E 41st St
San Angelo, TX 76903
$157,500F
2 bd · 1.5 ba ·
504 sqft ·
Built 1953
· SingleFamily
· Pending
· 233 DOM
Cashflow @ list (25.0% down · 7.5%)
Estimated rent
$942/mo
Mortgage (P&I)
−$826
Tax + insurance
−$375
HOA
−$0
Vac / Maint / Mgmt
−$198
Net cashflow
$-456/mo
Annual
$-5,477/yr
Cap rate
2.82%
Cash-on-cash
-12.42%
DSCR
0.45
1% rule
0.60%
Cash to close
$44,100
Investor read
- This is a 2-bed/1.5-bath single-family listed at $158k.
- At list price, monthly cash flow is $-456 ($-5k/yr) — negative.
- To cash-flow at today's rent, offer at most $77k (51.2% below list).
- To meet the 1% rule (rent ≥ 1% of price), the offer needs to be $94k (40.2% below list).
- It's been on market 233 days — a 12% lower offer ($139k) is reasonable based on typical stale-listing flexibility.
- Recommended offer: $77k (51.2% below list) — sets the bar for cash-flow.
- Local home prices are declining (-3.0%/yr); year-one equity from $1k of loan paydown is wiped out by about $5k of value loss. Plan a longer hold.
- Location reads 73/100 on livability (#199 in TX) — a middle-class / working-renter tenant base. Strengths: cost of living A+, housing A+, health & safety A+; Watch: employment C-, schools F, amenities F.
- San Angelo ISD (urban): math 27% / reading 33% proficiency, ranked #627 of 826 in TX (top 76%) — families likely to look elsewhere, expect single-tenant / working-renter base with shorter leases.
- Watch-outs: built in 1953 — expect roof / HVAC / electrical / plumbing capex.
- Market conditions: Rents rising fast (+8.5%/yr); 227 active listings in the ZIP; 3 comparable units currently listed for rent nearby; rentals at typical pace (median 22d on market — plan ~3-4 weeks tenant-placement turnaround); 233 units permitted in Tom Green County in 2024 (0 in 5+ unit buildings).
- Tom Green County population projected at +35% by 2050 — long-run rental-demand tailwind backs the buy-and-hold thesis.
- Climate carrying-cost: major wildfire risk; extreme-heat days projected 7→21/yr by 2055 (HVAC capex compounding) — expect insurance premiums to compound above CPI over the hold.
- Cap rate 2.8% vs local median 3.8% in San Angelo — below-typical yield; the buyer is paying a premium for something (appreciation thesis, condition, location) that the cap rate doesn't capture.
Questions for listing agent
- What do current leases actually rent for vs. the listed asking? Can we see a recent rent roll and the last 12 months of T-12 income?
- It's been on market 233 days. Have you received any prior offers? Is the seller open to a 51% concession, seller financing, or rate buy-down credit?
- Built in 1953 — when were the roof, HVAC, electrical panel, plumbing, and water heater last replaced?
- Why hasn't it sold? Are there any deal-killer items the seller is aware of (foundation, flood, title, zoning, code violations)?
- Is there a deadline driving the sale (1031 exchange, divorce, estate, relocation)? That informs how much negotiation room exists.
- Schools are F-rated, which usually means shorter tenancies and higher turnover. Who's the typical renter profile here, and what's been the actual vacancy rate?
- The area grade is low — what's the realistic commute time and amenity access for the typical tenant pool here? Any planned neighborhood developments (good or bad) we should know about?
- What's the average days-on-market for RENTAL listings here right now (not sales)? A rising rental-DOM trend means longer vacancies and softer asking-rent achievability than the comps imply.
CashFlowRE · CFR-9JHH6J3KE88RGC
· Data 3 weeks ago
cashflowre.app · 2026-05-29