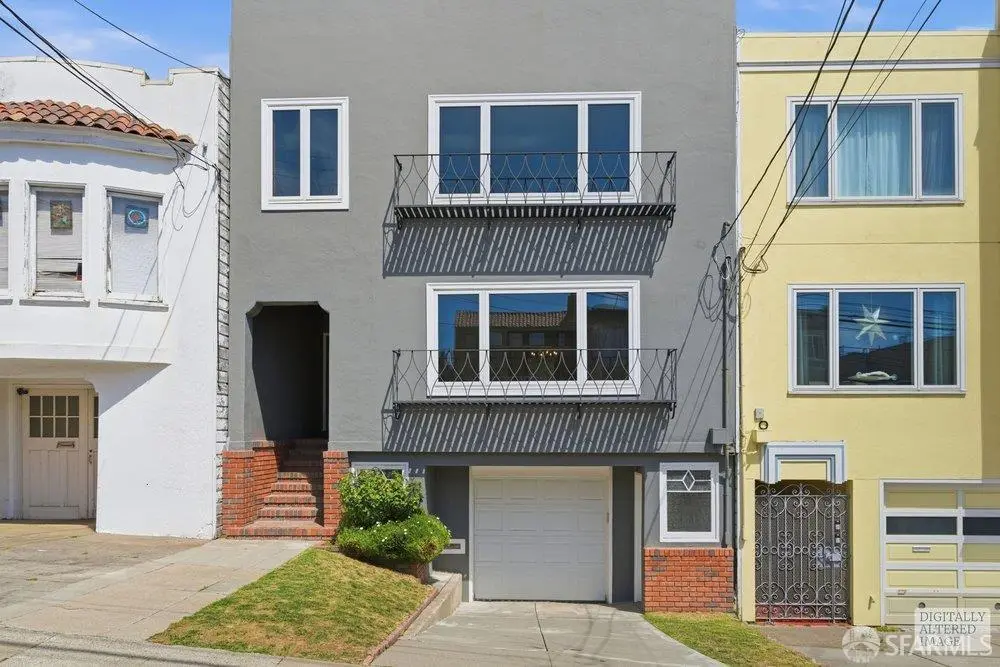
546-548 41st Ave
San Francisco, CA 94121
$1,348,000D
4 bd · 2.0 ba ·
2,850 sqft ·
Built 1927
· MultiFamily
· Pending
· 14 DOM
Cashflow @ list (25.0% down · 7.5%)
Estimated rent
$9,893/mo
Mortgage (P&I)
−$7,069
Tax + insurance
−$2,247
HOA
−$0
Vac / Maint / Mgmt
−$2,078
Net cashflow
$-1,500/mo
Annual
$-18,003/yr
Cap rate
4.96%
Cash-on-cash
-4.77%
DSCR
0.79
1% rule
0.73%
Cash to close
$377,440
Investor read
- This is a 2 × 2.0-bed/1.0-bath units multifamily listed at $1.35M.
- At list price, monthly cash flow is $-2k ($-18k/yr) — negative. Per door: $-750/mo.
- To cash-flow at today's rent, offer at most $1.13M (16.1% below list).
- To meet the 1% rule (rent ≥ 1% of price), the offer needs to be $989k (26.6% below list).
- Only 14 days on market — expect competitive offers; lowballing is unlikely to land.
- Recommended offer: $989k (26.6% below list) — sets the bar for 1% rule.
- Local home prices are declining (-3.0%/yr); year-one equity from $9k of loan paydown is wiped out by about $40k of value loss. Plan a longer hold.
- Location reads 76/100 on livability (#90 in CA, #3,143 nationally) — a middle-class / working-renter tenant base. Strengths: amenities A+, commute A+, employment A+; Watch: crime F, cost of living F.
- San Francisco Unified (urban): math 50% / reading 56% proficiency, ranked #322 of 1,400 in CA (top 23%) — acceptable for families but not a draw, mixed tenant base, ~2y average lease.
- Zoned schools: Lilienthal (Claire) Elementary (669 students, 19% FRL); Giannini (A.P.) Middle (1,192 students, 34% FRL); Lowell High (2,632 students, 37% FRL) — zoned schools average 30% FRL vs 49% district-wide (19 pts lower); this property's tenant base skews higher-income than the district average.
- Watch-outs: built in 1927 — expect roof / HVAC / electrical / plumbing capex.
- Market conditions: Rents rising fast (+13.0%/yr); 76 active listings in the ZIP; 2 comparable units currently listed for rent nearby; high-income renter base; 750 units permitted in San Francisco County in 2024 (688 in 5+ unit buildings).
- San Francisco County population projected at +39% by 2050 — long-run rental-demand tailwind backs the buy-and-hold thesis.
- Cap rate 5.0% vs local median 2.1% in San Francisco — top-decile yield for the area; either an underpriced asset or a hidden risk that comps aren't pricing in. Stress-test before assuming the spread holds.
- At $9,893/mo this rent would consume 89% of the median local household income ($133k/yr) (locally 2072% of renters already pay >50% of income on rent) — very limited rent-growth headroom before tenants either downsize or default.
Questions for listing agent
- What do current leases actually rent for vs. the listed asking? Can we see a recent rent roll and the last 12 months of T-12 income?
- Can we see the unit-by-unit rent roll, current vacancy, and any below-market leases? What's the average tenancy length?
- What capital expenditures (roof, boiler, parking lot, exteriors) have been made in the last 5 years, and what's planned in the next 2?
- Built in 1927 — when were the roof, HVAC, electrical panel, plumbing, and water heater last replaced?
- Is there a deadline driving the sale (1031 exchange, divorce, estate, relocation)? That informs how much negotiation room exists.
- Schools are B-rated — typically a magnet for longer-tenancy family renters. What's the average tenant stay here, and is there a school-zone premium baked into asking?
- Crime grade is F in this area — have there been break-ins, vandalism, or insurance claims at this property in the last 3 years? What carrier currently insures it and at what premium?
- The area grade is low — what's the realistic commute time and amenity access for the typical tenant pool here? Any planned neighborhood developments (good or bad) we should know about?
CashFlowRE · CFR-9N0V32536YT1GJ
· Data 3 weeks ago
cashflowre.app · 2026-05-29