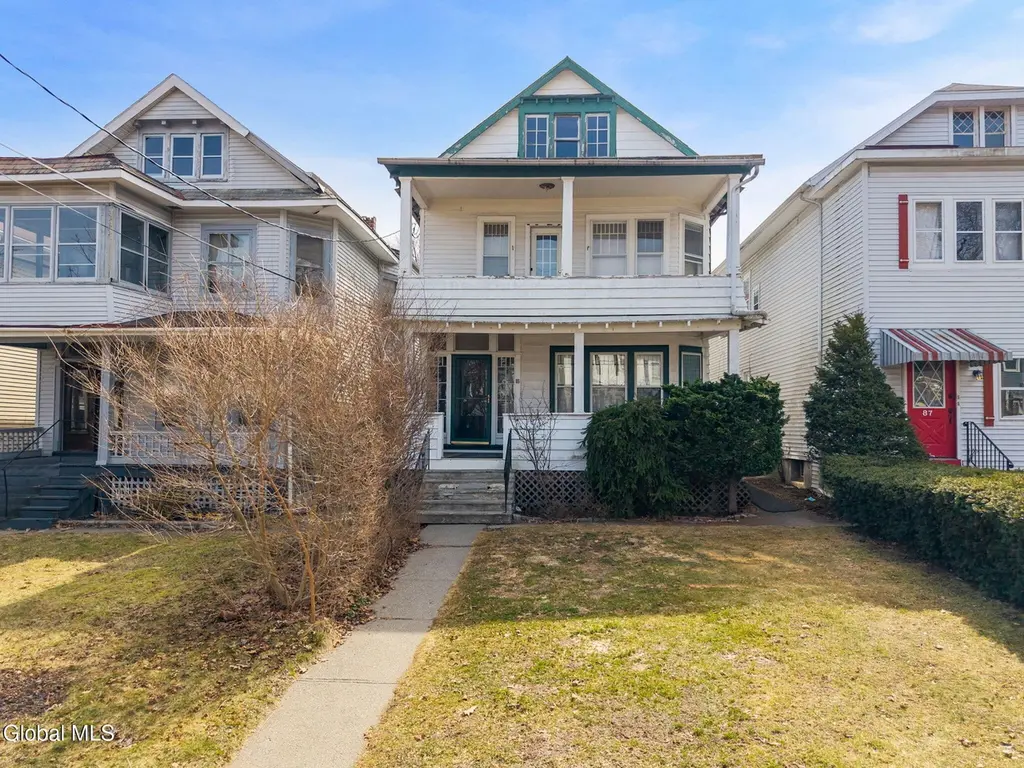
85 S Pine Ave
Albany, NY 12208
$350,000D+
6 bd · 2.0 ba ·
2,356 sqft ·
Built 1907
· MultiFamily
· Pending
· 3 DOM
Cashflow @ list (25.0% down · 7.5%)
Estimated rent
$3,697/mo
Mortgage (P&I)
−$1,835
Tax + insurance
−$686
HOA
−$0
Vac / Maint / Mgmt
−$776
Net cashflow
$399/mo
Annual
$4,787/yr
Cap rate
7.66%
Cash-on-cash
4.88%
DSCR
1.22
1% rule
1.06%
Cash to close
$98,000
Investor read
- This is a 2 × 2-bed/1.0-bath units multifamily listed at $350k.
- At list price, monthly cash flow is $399 ($5k/yr) — positive. Per door: $199/mo.
- The deal already cash-flows at list — no discount required.
- Meets the 1% rule at list price ($4k rent vs $350k).
- Only 3 days on market — expect competitive offers; lowballing is unlikely to land.
- Local home prices are declining (-3.0%/yr); year-one equity from $2k of loan paydown is wiped out by about $10k of value loss. Plan a longer hold.
- Location reads 79/100 on livability (#129 in NY, #2,083 nationally) — a middle-class / working-renter tenant base. Strengths: amenities A+, commute A+, housing A+; Watch: employment C-, crime F.
- Albany City School District (urban): math 37% / reading 40% proficiency, ranked #543 of 590 in NY (top 92%) — families likely to look elsewhere, expect single-tenant / working-renter base with shorter leases; 66% free/reduced lunch — lower-income household profile, screen leases tightly.
- Zoned schools: Pine Hills Elementary School (math 17% / reading 32%, grade F, #1,846 of 2,108 statewide, top 91%, 333 students, 72% FRL); Albany High School (math 74% / reading 67%, grade B+, #710 of 1,100 statewide, top 65%, 2,676 students, 69% FRL).
- Watch-outs: built in 1907 — expect roof / HVAC / electrical / plumbing capex.
- Market conditions: Rents rising fast (+5.0%/yr); 99 active listings in the ZIP; 1 comparable units currently listed for rent nearby; 675 units permitted in Albany County in 2024 (451 in 5+ unit buildings).
- Albany County population projected at +9% by 2050 — modest demand growth; plan on rents tracking national, not racing it.
- 5 sale attempts since 26y ago with the ask held roughly flat each time — persistent listings suggest the price (not the market) is what's stuck; bring a comps-based counter.
- Current owner paid $230k; list at $350k implies a 52% gain — meaningful room to come down on a strong offer.
- Cap rate 7.7% vs local median 5.7% in Albany — top-decile yield for the area; either an underpriced asset or a hidden risk that comps aren't pricing in. Stress-test before assuming the spread holds.
- At $3,697/mo this rent would consume 63% of the median local household income ($70k/yr) (locally 1952% of renters already pay >50% of income on rent) — very limited rent-growth headroom before tenants either downsize or default.
Questions for listing agent
- Can we see the unit-by-unit rent roll, current vacancy, and any below-market leases? What's the average tenancy length?
- What capital expenditures (roof, boiler, parking lot, exteriors) have been made in the last 5 years, and what's planned in the next 2?
- Built in 1907 — when were the roof, HVAC, electrical panel, plumbing, and water heater last replaced?
- Is there a deadline driving the sale (1031 exchange, divorce, estate, relocation)? That informs how much negotiation room exists.
- Crime grade is F in this area — have there been break-ins, vandalism, or insurance claims at this property in the last 3 years? What carrier currently insures it and at what premium?
- The area grade is low — what's the realistic commute time and amenity access for the typical tenant pool here? Any planned neighborhood developments (good or bad) we should know about?
- What's the average days-on-market for RENTAL listings here right now (not sales)? A rising rental-DOM trend means longer vacancies and softer asking-rent achievability than the comps imply.
- What's the recent tenant-quality profile in this submarket — average credit score on applications, eviction rate, late-payment / NSF rate, and stable-employment percentage? A property-management company in the area should have these aggregated.
CashFlowRE · CFR-9PM58J32R5SPT1
· Data 3 weeks ago
cashflowre.app · 2026-05-29