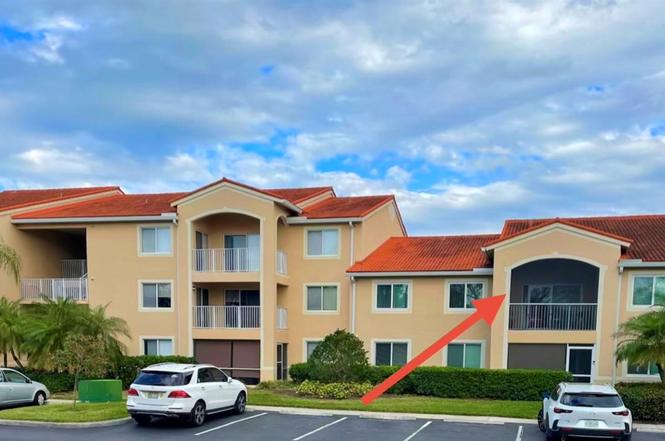
1610 N 42nd Cir #211
Gifford, FL 32967
$265,000D
3 bd · 2.0 ba ·
1,329 sqft ·
Built 2001
· Condo
· Active
· 152 DOM
Cashflow @ list (25.0% down · 7.5%)
Estimated rent
$2,793/mo
Mortgage (P&I)
−$1,390
Tax + insurance
−$389
HOA
−$519
Vac / Maint / Mgmt
−$586
Net cashflow
$-91/mo
Annual
$-1,096/yr
Cap rate
5.88%
Cash-on-cash
-1.48%
DSCR
0.93
1% rule
1.05%
Cash to close
$74,200
Investor read
- This is a 3-bed/2.0-bath condo listed at $265k.
- At list price, monthly cash flow is $-91 ($-1k/yr) — negative.
- To cash-flow at today's rent, offer at most $249k (6.1% below list).
- Meets the 1% rule at list price ($3k rent vs $265k).
- It's been on market 152 days — a 12% lower offer ($233k) is reasonable based on typical stale-listing flexibility.
- Recommended offer: $233k (12.0% below list) — sets the bar for market timing.
- Local home prices are declining (-3.0%/yr); year-one equity from $2k of loan paydown is wiped out by about $8k of value loss. Plan a longer hold.
- Location reads 68/100 on livability (#538 in FL) — a middle-class / working-renter tenant base. Strengths: commute A+, cost of living A+, health & safety A; Watch: schools D+, amenities F, employment F.
- Indian River (other): math 48% / reading 52% proficiency, ranked #35 of 73 in FL (top 48%) — acceptable for families but not a draw, mixed tenant base, ~2y average lease.
- Market conditions: Rents soft (-1.2%/yr); 612 active listings in the ZIP; 23 comparable units currently listed for rent nearby; rentals leasing fast (median 14d on market — plan ~1-2 weeks tenant-placement turnaround); solid renter incomes; 564 units permitted in Indian River County in 2024 (281 in 5+ unit buildings).
- Indian River County population projected at +18% by 2050 — long-run rental-demand tailwind backs the buy-and-hold thesis.
- 5 sale attempts since 7y ago; this cycle's ask has dropped $40k (13%) from the opening price — seller is motivated, your offer sets the floor, not the list.
- Climate carrying-cost: major flood risk; severe wind risk, 99% chance of damaging wind over 30y; extreme-heat days projected 7→25/yr by 2055 (HVAC capex compounding) — expect insurance premiums to compound above CPI over the hold.
- Cap rate 5.9% vs local median 3.0% in Gifford — top-decile yield for the area; either an underpriced asset or a hidden risk that comps aren't pricing in. Stress-test before assuming the spread holds.
- This rent runs 43% of the median local income ($78k/yr) — at the standard rent-burdened threshold; future hikes will face affordability resistance.
Questions for listing agent
- What do current leases actually rent for vs. the listed asking? Can we see a recent rent roll and the last 12 months of T-12 income?
- It's been on market 152 days. Have you received any prior offers? Is the seller open to a 12% concession, seller financing, or rate buy-down credit?
- What does the HOA fee cover, when was the last increase, and are there any pending special assessments or reserve-fund shortfalls?
- Any open or pending special assessments — roof, HVAC, plumbing, elevator, façade? What's the per-unit balance and payoff schedule, and is the seller paying it off at close or rolling it to the buyer?
- Why hasn't it sold? Are there any deal-killer items the seller is aware of (foundation, flood, title, zoning, code violations)?
- Is there a deadline driving the sale (1031 exchange, divorce, estate, relocation)? That informs how much negotiation room exists.
- Schools are D-rated, which usually means shorter tenancies and higher turnover. Who's the typical renter profile here, and what's been the actual vacancy rate?
- The area grade is low — what's the realistic commute time and amenity access for the typical tenant pool here? Any planned neighborhood developments (good or bad) we should know about?
CashFlowRE · CFR-9RE8H3FB29HTWN
· Data 1 day ago
cashflowre.app · 2026-05-29