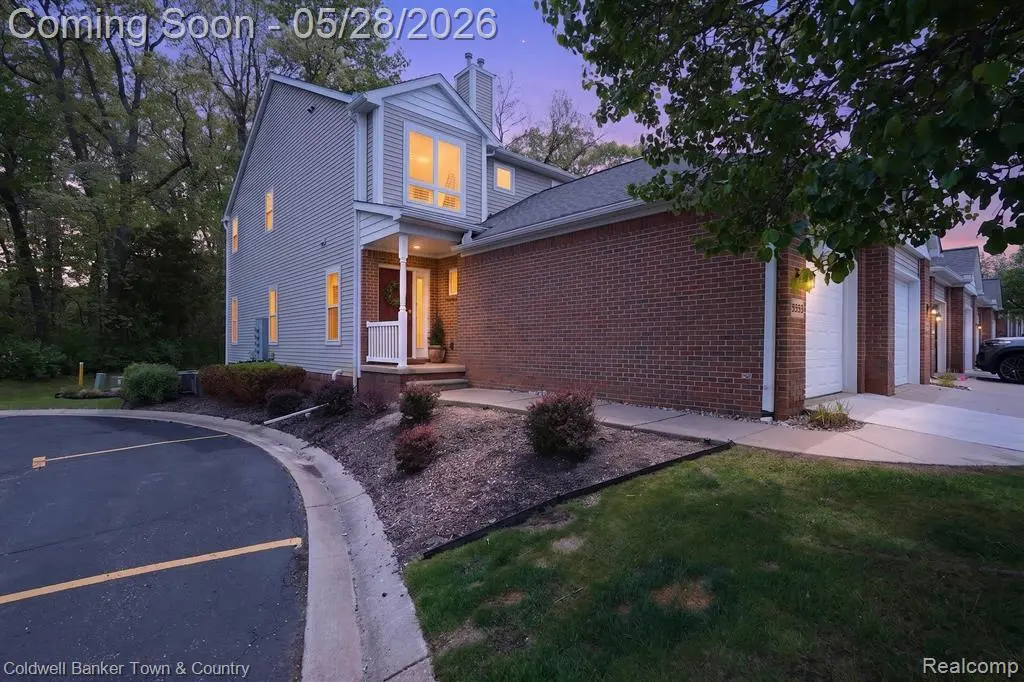
5551 Woodruff Shore Dr
Brighton, MI 48116
$310,000D-
2 bd · 2.5 ba ·
1,438 sqft ·
Built 2002
· Condo
· Active
· 22 DOM
Cashflow @ list (25.0% down · 7.5%)
Estimated rent
$2,751/mo
Mortgage (P&I)
−$1,626
Tax + insurance
−$354
HOA
−$345
Vac / Maint / Mgmt
−$578
Net cashflow
$-151/mo
Annual
$-1,818/yr
Cap rate
5.71%
Cash-on-cash
-2.09%
DSCR
0.91
1% rule
0.89%
Cash to close
$86,800
Investor read
- This is a 2-bed/2.5-bath condo listed at $310k.
- At list price, monthly cash flow is $-151 ($-2k/yr) — negative.
- To cash-flow at today's rent, offer at most $283k (8.6% below list).
- To meet the 1% rule (rent ≥ 1% of price), the offer needs to be $275k (11.2% below list).
- It's been on market 22 days — a 2% lower offer ($305k) is reasonable based on typical stale-listing flexibility.
- Recommended offer: $275k (11.2% below list) — sets the bar for 1% rule.
- Local home prices are declining (-3.0%/yr); year-one equity from $2k of loan paydown is wiped out by about $9k of value loss. Plan a longer hold.
- Location reads 78/100 on livability (#108 in MI, #2,621 nationally) — a middle-class / working-renter tenant base. Strengths: cost of living A+, housing A+, health & safety A+; Watch: amenities F, commute F.
- Brighton Area Schools (suburban): math 59% / reading 69% proficiency, ranked #22 of 540 in MI (top 4%) — acceptable for families but not a draw, mixed tenant base, ~2y average lease; only 10% free/reduced lunch — higher-income household profile.
- Market conditions: 178 active listings in the ZIP; 2 comparable units currently listed for rent nearby; solid renter incomes; 488 units permitted in Livingston County in 2024 (0 in 5+ unit buildings).
- Livingston County population projected at +7% by 2050 — modest demand growth; plan on rents tracking national, not racing it.
- 2 sale attempts since 3y ago; this cycle's ask is 15% above the opening price — seller raised mid-cycle; expect resistance to lowballs.
- Cap rate 5.7% vs local median 3.2% in Brighton — top-decile yield for the area; either an underpriced asset or a hidden risk that comps aren't pricing in. Stress-test before assuming the spread holds.
- This rent runs 31% of the median local income ($107k/yr) — at the standard rent-burdened threshold; future hikes will face affordability resistance.
Questions for listing agent
- What do current leases actually rent for vs. the listed asking? Can we see a recent rent roll and the last 12 months of T-12 income?
- What does the HOA fee cover, when was the last increase, and are there any pending special assessments or reserve-fund shortfalls?
- Any open or pending special assessments — roof, HVAC, plumbing, elevator, façade? What's the per-unit balance and payoff schedule, and is the seller paying it off at close or rolling it to the buyer?
- Is there a deadline driving the sale (1031 exchange, divorce, estate, relocation)? That informs how much negotiation room exists.
- Schools are A-rated — typically a magnet for longer-tenancy family renters. What's the average tenant stay here, and is there a school-zone premium baked into asking?
- The area grade is low — what's the realistic commute time and amenity access for the typical tenant pool here? Any planned neighborhood developments (good or bad) we should know about?
- What's the average days-on-market for RENTAL listings here right now (not sales)? A rising rental-DOM trend means longer vacancies and softer asking-rent achievability than the comps imply.
- What's the recent tenant-quality profile in this submarket — average credit score on applications, eviction rate, late-payment / NSF rate, and stable-employment percentage? A property-management company in the area should have these aggregated.
CashFlowRE · CFR-9RQQCD6JQGH8JS
· Data 2 days ago
cashflowre.app · 2026-05-29