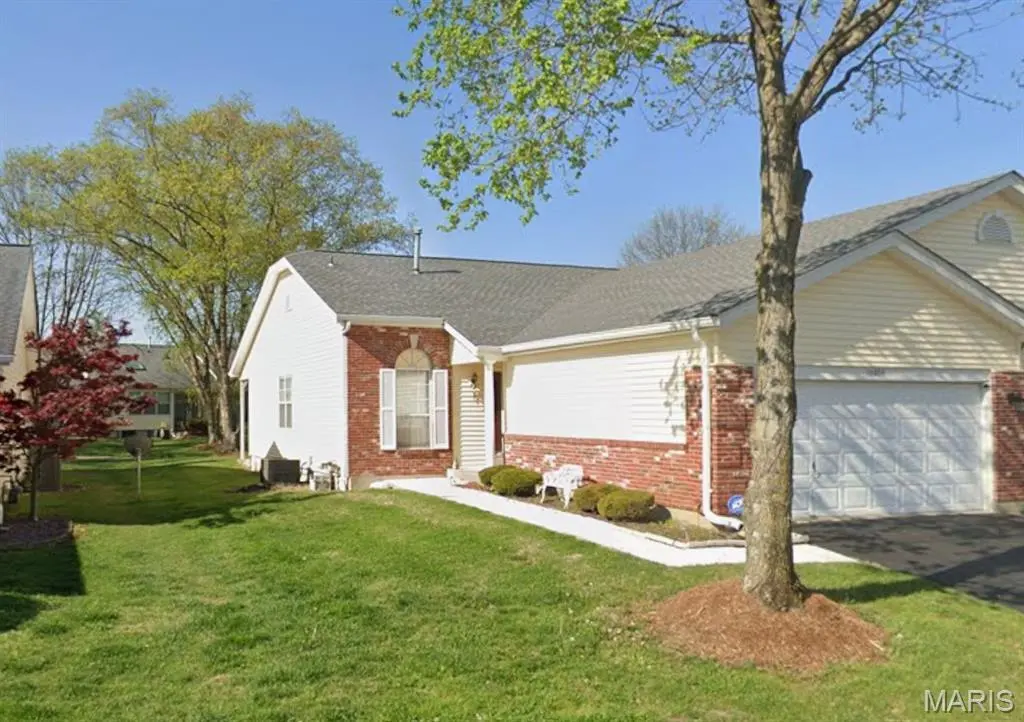
16054 Rose Wreath Ln
Old Jamestown, MO 63034
$162,000D
2 bd · 2.0 ba ·
1,284 sqft ·
Built 1988
· Condo
· Pending
· 1 DOM
Cashflow @ list (25.0% down · 7.5%)
Estimated rent
$1,862/mo
Mortgage (P&I)
−$850
Tax + insurance
−$248
HOA
−$374
Vac / Maint / Mgmt
−$391
Net cashflow
$-0/mo
Annual
$-2/yr
Cap rate
6.29%
Cash-on-cash
-0.00%
DSCR
1.00
1% rule
1.15%
Cash to close
$45,360
Investor read
- This is a 2-bed/2.0-bath condo listed at $162k.
- At list price, monthly cash flow is $0 ($-2/yr) — negative.
- To cash-flow at today's rent, offer at most $162k (0.0% below list).
- Meets the 1% rule at list price ($2k rent vs $162k).
- Only 1 days on market — expect competitive offers; lowballing is unlikely to land.
- Recommended offer: $162k (0.0% below list) — sets the bar for cash-flow.
- Local home prices are declining (-3.0%/yr); year-one equity from $1k of loan paydown is wiped out by about $5k of value loss. Plan a longer hold.
- Location reads 66/100 on livability (#247 in MO) — a middle-class / working-renter tenant base. Strengths: employment A+, housing A+, cost of living A; Watch: amenities F, commute F, health & safety F.
- Hazelwood (suburban): math 11% / reading 26% proficiency, ranked #306 of 324 in MO (top 94%) — low school quality limits family demand, transient renter base, plan for 1-2y turnover.
- Zoned schools: Barrington Elem. (math 9% / reading 28%, grade F, #960 of 1,115 statewide, top 86%, 393 students, 53% FRL); North Middle (math 16% / reading 28%, grade F, #332 of 391 statewide, top 86%, 674 students, 55% FRL); Hazelwood Central High (math 12% / reading 33%, grade F, #455 of 521 statewide, top 88%, 1,628 students, 52% FRL) — zoned schools at 53% FRL track the district average.
- Watch-outs: HOA is 20% of rent.
- Market conditions: 72 active listings in the ZIP; 4 comparable units currently listed for rent nearby; rentals at typical pace (median 15d on market — plan ~3-4 weeks tenant-placement turnaround); solid renter incomes; 920 units permitted in St. Louis County in 2024 (250 in 5+ unit buildings).
- Current owner paid $133k; 22% above their basis — modest negotiation headroom, anchor on the comps not their cost.
- Climate carrying-cost: extreme-heat days projected 7→21/yr by 2055 (HVAC capex compounding) — expect insurance premiums to compound above CPI over the hold.
- Cap rate 6.3% vs local median 5.2% in Old Jamestown — meaningfully above typical; check what's discounted (condition, days-on-market, listing class) to confirm the premium yield is real.
Questions for listing agent
- What do current leases actually rent for vs. the listed asking? Can we see a recent rent roll and the last 12 months of T-12 income?
- What does the HOA fee cover, when was the last increase, and are there any pending special assessments or reserve-fund shortfalls?
- Any open or pending special assessments — roof, HVAC, plumbing, elevator, façade? What's the per-unit balance and payoff schedule, and is the seller paying it off at close or rolling it to the buyer?
- Is there a deadline driving the sale (1031 exchange, divorce, estate, relocation)? That informs how much negotiation room exists.
- The area grade is low — what's the realistic commute time and amenity access for the typical tenant pool here? Any planned neighborhood developments (good or bad) we should know about?
- What's the average days-on-market for RENTAL listings here right now (not sales)? A rising rental-DOM trend means longer vacancies and softer asking-rent achievability than the comps imply.
- What's the recent tenant-quality profile in this submarket — average credit score on applications, eviction rate, late-payment / NSF rate, and stable-employment percentage? A property-management company in the area should have these aggregated.
- How much new apartment / multifamily construction is in the pipeline within 1–3 miles? Heavy new supply (>2% of stock underway) typically softens rents 12–24 months out; light construction supports rent growth.
CashFlowRE · CFR-9RZ1KH7PXM196M
· Data 1 day ago
cashflowre.app · 2026-05-29