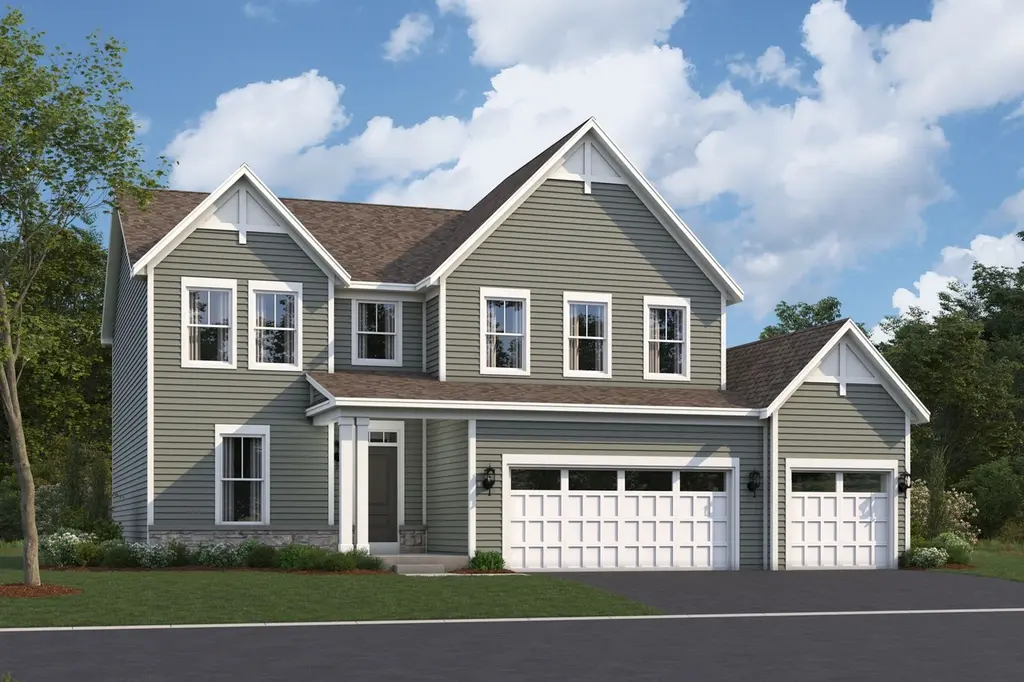
Easton Plan
Plainfield, IL 60585
$567,990F
4 bd · 2.5 ba ·
2,688 sqft ·
Built —
· SingleFamily
· Active
· 524 DOM
Cashflow @ list (25.0% down · 7.5%)
Estimated rent
$4,292/mo
Mortgage (P&I)
−$3,479
Tax + insurance
−$1,106
HOA
−$80
Vac / Maint / Mgmt
−$901
Net cashflow
$-1,274/mo
Annual
$-15,294/yr
Cap rate
3.99%
Cash-on-cash
-8.23%
DSCR
0.63
1% rule
0.65%
Cash to close
$185,769
Investor read
- This is a 4-bed/2.5-bath single-family listed at $568k. Condition is rated excellent.
- At list price, monthly cash flow is $-1k ($-15k/yr) — negative.
- To cash-flow at today's rent, offer at most $479k (15.7% below list).
- To meet the 1% rule (rent ≥ 1% of price), the offer needs to be $429k (24.4% below list).
- It's been on market 524 days — a 12% lower offer ($500k) is reasonable based on typical stale-listing flexibility.
- Recommended offer: $429k (24.4% below list) — sets the bar for 1% rule.
- Local home prices are declining (-3.0%/yr); year-one equity from $5k of loan paydown is wiped out by about $20k of value loss. Plan a longer hold.
- Location reads 67/100 on livability (#496 in IL) — a middle-class / working-renter tenant base. Strengths: crime A+, employment A+, housing A+; Watch: amenities F, commute F, cost of living F.
- Plainfield SD 202 (suburban): math 25% / reading 32% proficiency, ranked #213 of 620 in IL (top 34%) — low school quality limits family demand, transient renter base, plan for 1-2y turnover; only 17% free/reduced lunch — higher-income household profile.
- Zoned schools: Walkers Grove Elementary School (math 34% / reading 55%, grade F, #267 of 2,056 statewide, top 15%, 626 students, 0% FRL); Richard Ira Jones Middle School (math 30% / reading 42%, grade F, #182 of 665 statewide, top 28%, 837 students, 0% FRL); Plainfield North High School (math 40% / reading 40%, grade F, #85 of 693 statewide, top 12%, 2,377 students, 0% FRL) — zoned schools average 0% FRL vs 17% district-wide (17 pts lower); this property's tenant base skews higher-income than the district average.
- Market conditions: 279 active listings in the ZIP; 16 comparable units currently listed for rent nearby; rentals at typical pace (median 30d on market — plan ~3-4 weeks tenant-placement turnaround); 44% of comp listings sitting > 30 days — soft ceiling on asking rent; high-income renter base; 2,028 units permitted in Will County in 2024 (530 in 5+ unit buildings).
- Will County population projected to shrink 4% by 2050 — rents likely to lag national; underwrite the cash flow, not the appreciation.
- This rent runs 34% of the median local income ($151k/yr) — at the standard rent-burdened threshold; future hikes will face affordability resistance.
Questions for listing agent
- What do current leases actually rent for vs. the listed asking? Can we see a recent rent roll and the last 12 months of T-12 income?
- It's been on market 524 days. Have you received any prior offers? Is the seller open to a 24% concession, seller financing, or rate buy-down credit?
- What does the HOA fee cover, when was the last increase, and are there any pending special assessments or reserve-fund shortfalls?
- Why hasn't it sold? Are there any deal-killer items the seller is aware of (foundation, flood, title, zoning, code violations)?
- Is there a deadline driving the sale (1031 exchange, divorce, estate, relocation)? That informs how much negotiation room exists.
- The area grade is low — what's the realistic commute time and amenity access for the typical tenant pool here? Any planned neighborhood developments (good or bad) we should know about?
- What's the average days-on-market for RENTAL listings here right now (not sales)? A rising rental-DOM trend means longer vacancies and softer asking-rent achievability than the comps imply.
- What's the recent tenant-quality profile in this submarket — average credit score on applications, eviction rate, late-payment / NSF rate, and stable-employment percentage? A property-management company in the area should have these aggregated.
CashFlowRE · CFR-9TCT3G3E1GYZ5H
· Data 11 h ago
cashflowre.app · 2026-05-29