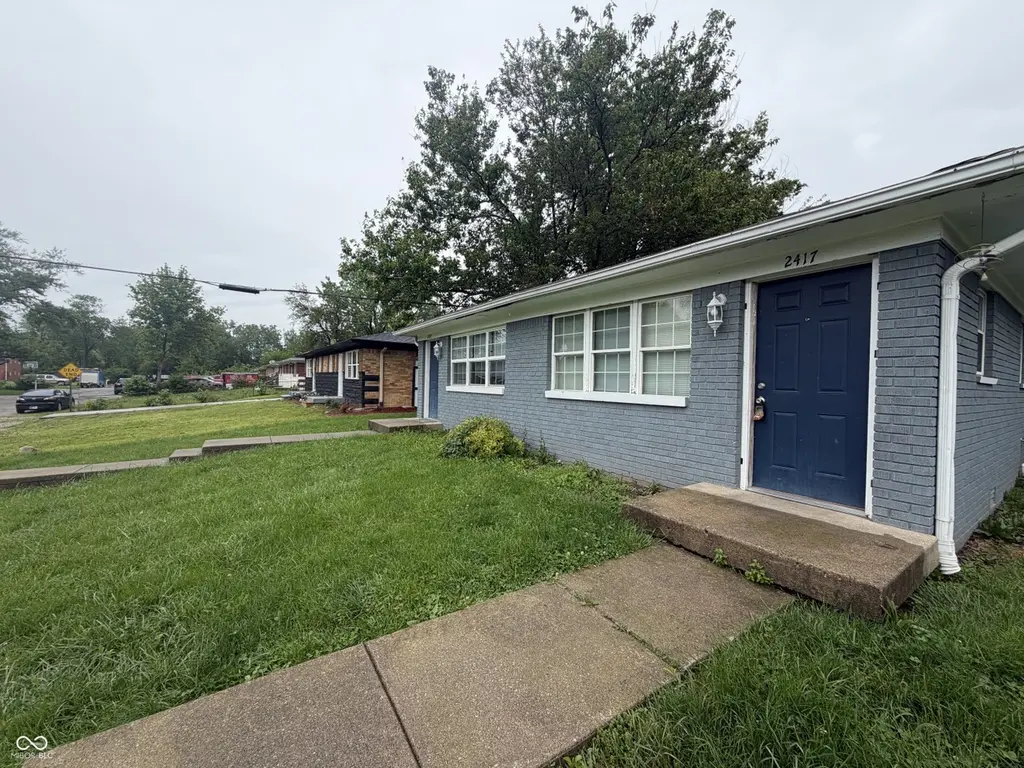
2417 N Bolton Ave
Indianapolis city (balance), IN 46218
$199,900D-
2 bd · None ba ·
768 sqft ·
Built 1965
· MultiFamily
· Active
· 30 DOM
Cashflow @ list (25.0% down · 7.5%)
Estimated rent
$1,805/mo
Mortgage (P&I)
−$1,048
Tax + insurance
−$392
HOA
−$0
Vac / Maint / Mgmt
−$379
Net cashflow
$-15/mo
Annual
$-176/yr
Cap rate
6.21%
Cash-on-cash
-0.31%
DSCR
0.99
1% rule
0.90%
Cash to close
$55,972
Investor read
- This is a 2 × 2-bed/1-bath units multifamily listed at $200k.
- At list price, monthly cash flow is $-15 ($-176/yr) — negative. Per door: $-7/mo.
- To cash-flow at today's rent, offer at most $197k (1.3% below list).
- To meet the 1% rule (rent ≥ 1% of price), the offer needs to be $180k (9.7% below list).
- It's been on market 30 days — a 2% lower offer ($197k) is reasonable based on typical stale-listing flexibility.
- Recommended offer: $180k (9.7% below list) — sets the bar for 1% rule.
- Local home prices are declining (-3.0%/yr); year-one equity from $1k of loan paydown is wiped out by about $6k of value loss. Plan a longer hold.
- Location reads: area grade D — affects rentability + tenant quality, not the cash-flow math above.
- Indianapolis Public Schools (urban): math 14% / reading 20% proficiency, ranked #286 of 301 in IN (top 95%) — low school quality limits family demand, transient renter base, plan for 1-2y turnover; 77% free/reduced lunch — lower-income household profile, screen leases tightly.
- Zoned schools: Center For Inquiry School 27 (math 25% / reading 29%, grade F, #737 of 994 statewide, top 76%, 525 students, 51% FRL); H L Harshman Middle School (math 3% / reading 16%, grade F, #316 of 330 statewide, top 96%, 549 students, 84% FRL).
- Market conditions: Rents flat; 338 active listings in the ZIP; 37 comparable units currently listed for rent nearby; rentals at typical pace (median 26d on market — plan ~3-4 weeks tenant-placement turnaround); lower-income renter base — watch delinquency; 1,906 units permitted in Marion County in 2024 (621 in 5+ unit buildings).
- Marion County population projected at +18% by 2050 — long-run rental-demand tailwind backs the buy-and-hold thesis.
- 4 sale attempts since 18y ago; this cycle's ask is 20942% above the opening price — seller raised mid-cycle; expect resistance to lowballs.
- Cap rate 6.2% vs local median 4.4% in Indianapolis city (balance) — top-decile yield for the area; either an underpriced asset or a hidden risk that comps aren't pricing in. Stress-test before assuming the spread holds.
- At $1,805/mo this rent would consume 57% of the median local household income ($38k/yr) (locally 2340% of renters already pay >50% of income on rent) — very limited rent-growth headroom before tenants either downsize or default.
Questions for listing agent
- What do current leases actually rent for vs. the listed asking? Can we see a recent rent roll and the last 12 months of T-12 income?
- Can we see the unit-by-unit rent roll, current vacancy, and any below-market leases? What's the average tenancy length?
- What capital expenditures (roof, boiler, parking lot, exteriors) have been made in the last 5 years, and what's planned in the next 2?
- Built in 1965 — when were the roof, HVAC, electrical panel, plumbing, and water heater last replaced?
- Is there a deadline driving the sale (1031 exchange, divorce, estate, relocation)? That informs how much negotiation room exists.
- The area grade is low — what's the realistic commute time and amenity access for the typical tenant pool here? Any planned neighborhood developments (good or bad) we should know about?
- What's the average days-on-market for RENTAL listings here right now (not sales)? A rising rental-DOM trend means longer vacancies and softer asking-rent achievability than the comps imply.
- What's the recent tenant-quality profile in this submarket — average credit score on applications, eviction rate, late-payment / NSF rate, and stable-employment percentage? A property-management company in the area should have these aggregated.
CashFlowRE · CFR-9Z2F6GD076BK1N
· Data 1 day ago
cashflowre.app · 2026-05-29