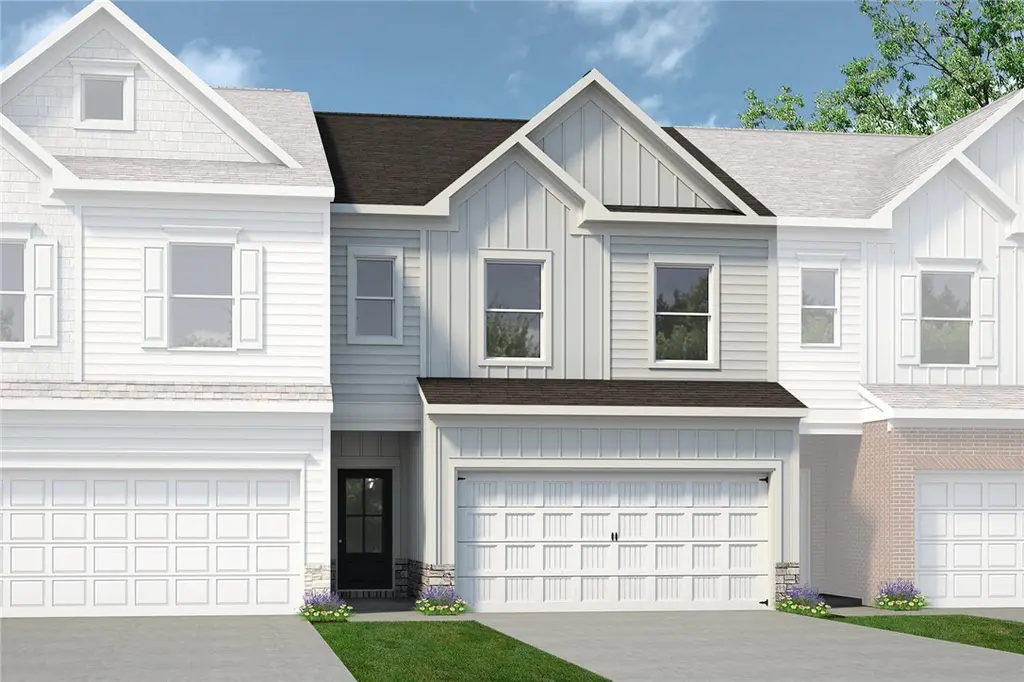
128 Brass Tack Dr
Powdersville, SC 29611
$244,990D
3 bd · 2.5 ba ·
1,807 sqft ·
Built 2026
· Townhouse
· Active
· 10 DOM
Cashflow @ list (25.0% down · 7.5%)
Estimated rent
$2,010/mo
Mortgage (P&I)
−$1,285
Tax + insurance
−$408
HOA
−$0
Vac / Maint / Mgmt
−$422
Net cashflow
$-105/mo
Annual
$-1,265/yr
Cap rate
5.78%
Cash-on-cash
-1.84%
DSCR
0.92
1% rule
0.82%
Cash to close
$68,597
Investor read
- This is a 3-bed/2.5-bath townhouse listed at $245k. Condition is rated good.
- At list price, monthly cash flow is $-105 ($-1k/yr) — negative.
- To cash-flow at today's rent, offer at most $230k (6.2% below list).
- To meet the 1% rule (rent ≥ 1% of price), the offer needs to be $201k (18.0% below list).
- Only 10 days on market — expect competitive offers; lowballing is unlikely to land.
- Recommended offer: $201k (18.0% below list) — sets the bar for 1% rule.
- Local home prices are declining (-3.0%/yr); year-one equity from $2k of loan paydown is wiped out by about $7k of value loss. Plan a longer hold.
- Location reads 66/100 on livability (#110 in SC) — a middle-class / working-renter tenant base. Strengths: housing A+, cost of living A-, crime B+; Watch: amenities F, commute F.
- Anderson 01 (rural): math 58% / reading 60% proficiency, ranked #3 of 80 in SC (top 4%) — acceptable for families but not a draw, mixed tenant base, ~2y average lease.
- Zoned schools: Powdersville Elementary (math 75% / reading 62%, grade B+, #41 of 597 statewide, top 7%, 751 students, 49% FRL).
- Market conditions: Rents rising (+1.7%/yr); 278 active listings in the ZIP; 2 comparable units currently listed for rent nearby; 1,255 units permitted in Anderson County in 2024 (0 in 5+ unit buildings).
- Anderson County population projected at +14% by 2050 — modest demand growth; plan on rents tracking national, not racing it.
- 4 sale attempts with the ask held roughly flat each time — persistent listings suggest the price (not the market) is what's stuck; bring a comps-based counter.
- Cap rate 5.8% vs local median 2.9% in Powdersville — top-decile yield for the area; either an underpriced asset or a hidden risk that comps aren't pricing in. Stress-test before assuming the spread holds.
- At $2,010/mo this rent would consume 47% of the median local household income ($52k/yr) (locally 1754% of renters already pay >50% of income on rent) — very limited rent-growth headroom before tenants either downsize or default.
Questions for listing agent
- What do current leases actually rent for vs. the listed asking? Can we see a recent rent roll and the last 12 months of T-12 income?
- Is there a deadline driving the sale (1031 exchange, divorce, estate, relocation)? That informs how much negotiation room exists.
- Schools are F-rated, which usually means shorter tenancies and higher turnover. Who's the typical renter profile here, and what's been the actual vacancy rate?
- The area grade is low — what's the realistic commute time and amenity access for the typical tenant pool here? Any planned neighborhood developments (good or bad) we should know about?
- What's the average days-on-market for RENTAL listings here right now (not sales)? A rising rental-DOM trend means longer vacancies and softer asking-rent achievability than the comps imply.
- What's the recent tenant-quality profile in this submarket — average credit score on applications, eviction rate, late-payment / NSF rate, and stable-employment percentage? A property-management company in the area should have these aggregated.
- How much new for-sale + rental construction is in the pipeline within 1–3 miles? Heavy new supply typically softens prices + rents 12–24 months out; constrained supply supports both.
CashFlowRE · CFR-9ZBXQ2FPMP9AH8
· Data 6 days ago
cashflowre.app · 2026-05-29